Citation:
Guo Wen LI, Xue Wen HU, Hong DING, Ying Qiu LIANG. SYNTHESIS OF A NOVEL AMPHIPHILE, 4-[4-(4-DECYLOXYPHENYLAZO) NAPHTHYLOXY] BUTYL TRIMETHYLAMMONIUM BROMIDE, AND ITS SELF-ASSEMBLING BEHAVIOR IN DILUTE AQUEOUS SOLUTION[J]. Chinese Chemical Letters,
;1991, 2(10): 817-820.

-
A novel amphiphile of 4-[4-(4-decyloxyphenylazo) naphthyloxy] butyl trimethylammonium bromide has been synthesized. It can form the stable bilayer in dilute aqueous solution.
-
1. INTRODUCTION
Esters are one of the important high-yield compounds. They are often used in the production of plastics. They are usually found in plastic pipes, furniture, floors, car interiors, insect repellents and cosmetics. Methyl p-hydroxybenzoate is the methyl ester of p-hydroxybenzoic acid (PHBA), which is widely used in cosmetics, toothpaste, hair care products, moisturizers and deodorants. Due to the wide applications of esters, more and more ester compounds enter the water environment and cause harm to living animals and plants[1-3]. Comprehensive acquisition of various property parameters of organic compounds is of great significance for standardizing their production and application[4, 5]. At present, the toxicity of ester compounds is mainly determined by experiments, which wastes resources such as chemical reagents and time. Moreover, the number of such compounds is huge, and it is difficult to measure various parameters only by experimental means. The study of the relationship between the structures and properties of compounds is of great significance for analyzing and evaluating various properties or environmental behaviors of compounds, and assisting in the identification of compounds. The parameterized characterization of structures of compounds is one of the key steps to establish the relationships between compound structures and properties. At present, two-dimensional structure characterization methods[6-8] and three-dimensional structure characterization methods[9-11] are widely used. The two-dimensional structure characterization methods are simple and fast, but they are difficult to reflect the three-dimensional structure characteristics of the compounds, and cannot distinguish phenomena such as cis-trans isomerisms. The three-dimensional structure characterization methods are relatively complicated, but they can be calculated based on the three-dimensional structures of compound molecules and can distinguish various isomerism phenomena. In the present study, three-dimensional structure descriptors were used to characterize the structures of some ester compounds, and then the multiple linear regression (MLR) and the partial least-squares regression (PLS) were used to establish the models of relationship between compound structures and toxicity, and the structural factors affecting compound toxicity were analyzed. This paper can provide a reference for the study of the structure-property relationship of ester compounds.
2. MATERIALS AND METHODS
2.1 Experimental materials
In the present study, two QSAR models for the modeling and predicting aquatic toxicity log(1/IGC50) of 48 aliphatic esters were proposed. The experimental toxic activities which show toxic effects on the Tetrahymena pyriformis protozoa ciliate were taken from literature[12]. The samples were divided into the training and test sets, and the test set samples were marked with "*".
Table 1
No. Compound log(1/IGC50) Cal.1 Err.1 Cal.2 Err.2 1 Methyl propionate –1.6092 –1.5590 0.0502 –1.4715 0.1377 2 Methyl acetate –1.5954 –1.5562 0.0392 –1.5655 0.0299 3 Methyl formate –1.4982 –1.4494 0.0488 –1.5288 –0.0306 4 Isobutyl formate –1.3081 –1.2827 0.0254 –1.2795 0.0286 5 Ethyl acetate –1.2968 –1.3663 –0.0695 –1.4073 –0.1105 6* Methyl butyrate –1.2463 –1.1420 0.1043 –1.2100 0.0363 7 Propyl acetate –1.2382 –1.2242 0.0140 –1.1971 0.0411 8 Propargyl acetate –1.1664 –1.1194 0.0470 –1.0973 0.0691 9 Methyl-2-methylbutyrate –1.1650 –1.1455 0.0195 –1.1315 0.0335 10 Propyl formate –1.0221 –1.0157 0.0064 –1.0858 –0.0637 11 Ethyl propionate –0.9450 –0.9949 –0.0499 –0.9595 –0.0145 12* Butyl formate –0.9336 –1.0219 –0.0883 –1.0213 –0.0877 13 2-Butynyl-acetate –0.8834 –0.9355 –0.0521 –0.9029 –0.0195 14 Allyl propionate –0.8791 –0.8433 0.0358 –0.8546 0.0245 15 Vinyl acetate –0.8595 –0.9203 –0.0608 –0.9553 –0.0958 16 Methyl valerate –0.8448 –0.9251 –0.0803 –0.8212 0.0236 17 Propyl propionate –0.8148 –0.801 0.0138 –0.7775 0.0373 18* n-Amyl formate –0.7826 –0.7211 0.0615 –0.7747 0.0079 19 Ethyl isovalerate –0.7231 –0.7248 –0.0017 –0.6337 0.0894 20 Isobutyl propionate –0.6935 –0.682 0.0115 –0.7108 –0.0173 21 sec-Butyl acetate –0.6794 –0.6654 0.0140 –0.6543 0.0251 22 Propargyl propionate –0.6554 –0.6309 0.0245 –0.5868 0.0686 23 Vinyl propionate –0.6530 –0.6674 –0.0144 –0.6660 –0.0130 24* Allyl butyrate –0.6355 –0.6213 0.0142 –0.6575 –0.0220 25 Methyl hexanoate –0.5611 –0.6319 –0.0708 –0.5988 –0.0377 26 Ethyl butyrate –0.4903 –0.4893 0.0010 –0.5039 –0.0136 27 Butyl acetate –0.4864 –0.5145 –0.0281 –0.5736 –0.0872 28 Propyl butyrate –0.4138 –0.4264 –0.0126 –0.4703 –0.0565 29 Tert butyl propionate –0.4095 –0.4075 0.0020 –0.4722 –0.0627 30* Vinyl butyrate –0.3825 –0.3511 0.0314 –0.3094 0.0731 31 n-Hexyl formate –0.3824 –0.3565 0.0259 –0.3952 –0.0128 32 Ethyl valerate –0.3580 –0.3624 –0.0044 –0.4302 –0.0722 33 2-Ethylbutyl acetate –0.1202 –0.1015 0.0187 –0.1263 –0.0061 34 Amyl propionate –0.0431 –0.0526 –0.0095 –0.0444 –0.0013 35 Hexyl acetate –0.0087 –0.0081 0.0006 –0.0144 –0.0057 36* Propyl valerate 0.0094 0.0230 0.0136 –0.0083 –0.0177 37 Ethyl hexanoate 0.0637 0.0715 0.0078 0.0607 –0.0030 38 Methyl heptanoate 0.1039 0.0982 –0.0057 0.1446 0.0407 39 Allyl hexanoate 0.2128 0.2714 0.0586 0.2558 0.0430 40 Methyl octanoate 0.5358 0.5063 –0.0295 0.5348 –0.0010 41 Allyl heptanoate 0.7282 0.8174 0.0892 0.8435 0.1153 42* Methyl nonanoate 1.0419 1.1275 0.0856 1.1337 0.0918 43 Vinyl 2-ethylhexanoate 1.0462 0.9630 –0.0832 0.9030 –0.1432 44 Octyl acetate 1.0570 1.0820 0.0250 1.1547 0.0977 45 Tert butyl formate 1.3719 1.3398 –0.0321 1.4095 0.0376 46 Methyl decanoate 1.3778 1.3225 –0.0553 1.2409 –0.1369 47 Methyl undecanoate 1.4248 1.5058 0.0810 1.4757 0.0509 48* Decyl acetate 1.8794 1.8081 –0.0713 1.7688 –0.1106 2.2 Experimental methods
2.2.1 Characterization of the compound structure
The 3D holographic vector of atomic interaction field (3D-HoVAIF)[13-15] started from the two spatial invariants of the three-dimensional structures of molecules—the relative distance of atoms and the properties of the atoms themselves based on three classical non-bonding interaction modes between atoms, such as electrostatic, stereo and hydrophobic interactions. It provided three-dimensional vector descriptors for characterizing the molecular structures of compounds without any experimental parameters. The molecules of common organic compounds usually include hydrogen, carbon, nitrogen, phosphorus, oxygen, sulfur, fluorine, chlorine, bromine and iodine. They belong to five main groups in the periodic table, such as IA, IVA, VA, VIA and VIIA. Based on this, these atoms could be divided into 5 categories. At the same time, in order to characterize the microenvironment of the molecular structure more accurately, according to the above classification, the atoms in different main groups were further subdivided into 10 categories according to their hybrid state (1.H, 2. C(sp)3, 3. C(sp)2, 4. C(sp), 5. N(sp)3, P(sp)3, 6. N(sp)2, P(sp)2, 7. N(sp), P(sp), 8. O(sp)3, S(sp)3, 9. O(sp)2, S(sp)2 and 10. F, Cl, Br, I). The interaction between various atoms in a compound molecule could be up to 10×(10+1)/2 = 55 items. 3D-HoVAIF used three potential energies (electrostatic, stereo and hydrophobic) to express different forms of action. Therefore, for an organic compound molecule, there were at most 3×55 = 165 atomic action terms to characterize the molecular structure information. Although the atomic interaction mode in 3D-HoVAIF was not a direct manifestation of the compound, in most cases, the 3D-HoVAIF descriptors contained a wealth of information on the potential energy distribution of organic compounds, which could well characterize the microenvironment of the molecules.
2.2.1.1 Electrostatic interaction
The electrical effect of atoms is proportional to the charge and inversely proportional to the distance between atoms. As an important form of non-bonding interaction, electrostatic interaction was expressed by the classic Coulomb theorem (Eq. (1)). Among them, rij (nm) was the Euclid distance between atoms; e was the unit charge amount of 1.6021892 × 10⁻¹⁹ C; ε0 was the dielectric constant in vacuum 8.85418782 × 10⁻¹² C2/J·m; Z was the net charge of the atom, the electron as the unit; m and n were the types of atoms. The electrostatic potential between all atoms in the molecule was calculated by this formula, and count into 55 electrostatic interaction terms according to their type.
EE(m−n)=∑i∈m,j∈ne24πε0⋅Zi⋅Zjrij(1≤m≤10,≤n≤10) (1) 2.2.1.2 Steric interaction
The steric interaction is the nondipole-dipole or dipole induced interaction between atoms in space. The Lennard-Jones equation was used to describe this mode of action (Eq. (2)). In the formula, εij = (εii·εjj)1/2 was the depth of the atom-pair potential energy well, which was taken from the literature[16]; D was the empirically derived interatomic interaction energy correction constant taken as 0.01[17]; Rij* = (Ch·Rii*+ Ch·Rjj*)/2, which was the corrected atom pair van der Waals radius, the correction factor Ch was 1.00 of sp3 hybridization, 0.95 of sp2 hybridization, and 0.90 of sp hybridization[17].
$ ES(m−n)=∑i∈m,j∈nεij⋅D⋅[(R∗ijrij)12−2⋅(R∗ijrij)6](1≤m10,m≤n≤10) (2) 2.2.1.3 Hydrophobic interaction
Hydrophobic interaction is one of the factors that affect on the properties of compounds. Considering that the 3D-HoVAIF descriptors required to express the interaction between atoms in the molecule, the hint method proposed by Kellogg et al.[18-22] was used to express this type of potential field. A simple expression for calculating the hydrophobic interaction between two atoms was defined in the hint (Eq. (3)). In the formula, S was the solvent accessible surface area
of atom (SASA), which was the surface area formed by water molecules (van der Waals radius of 0.14 nm) as the probe rolls its sphere on the surface of the atom[23]. T was a binary discriminant function of the action form to indicate the direction of the entropy effect of the hydrophobic interaction of different types of atoms[18-22], and a was the atomic hydrophobicity constant, taking the literature value[24].
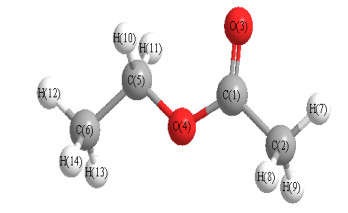
EH(m−n)=10−3∑i∈m,j∈nSi⋅ai⋅Sj⋅aj⋅e−rij⋅Tij(1≤m≤10,m≤n≤10)(3) (3) The Chemoffice 2006 was used to construct the molecular three-dimensional structures of the studied samples, and the MOPAC semi-empirical quantum chemistry software that comes with Chem3D was used to optimize the molecular structures and get the position coordinates of the atoms in the molecules at the AM1 level, and the Mulliken layout analysis method was used to calculate the net charge e of the atom in a single-point form (e.g., ethyl acetate dimensional structure is shown in Fig. 1. The position coordinates of each atom and the net charge quantity e are shown in Table 2). The space position coordinates of each atom in the molecule were used to calculate the distance rij between atoms, and finally the 165 3D-HoVAIF descriptors were obtained by formulas (1), (2) and (3).
Figure 1
Table 2
Atom e x y z C(1) 0.355728 0.2291 –1.2842 –0.0000 C(2) –0.357127 1.5360 –2.0388 –0.0000 O(3) –0.397118 –0.8170 –1.8882 –0.0000 O(4) –0.322514 0.2292 0.0538 –0.0000 C(5) –0.098051 –0.9849 0.7548 –0.0000 C(6) –0.35570 –0.7074 2.2523 –0.0000 H(7) 0.152265 2.3823 –1.3160 –0.0000 H(8) 0.170018 1.5947 –2.6780 0.9092 H(9) 0.170076 1.5948 –2.6787 –0.9088 H(10) 0.137276 –1.5679 0.4860 0.9092 H(11) 0.137362 –1.5684 0.4858 –0.9088 H(12) 0.137378 –1.6713 2.8088 –0.0000 H(13) 0.135164 –0.1245 2.5210 –0.9093 H(14) 0.135243 –0.1239 2.5213 0.9088 2.2.2 Modeling and evaluation
The stepwise regression (SMR) is a commonly used method for variable screening, so it was used to screen the original descriptors. Multiple linear regression (MLR) and partial least-squares regression (PLS) are commonly used methods for modeling, and therefore multiple linear regression (MLR) and partial least-squares regression (PLS) were used to build models. An excellent model must meet the following requirements: 1) Modeling correlation coefficient (R2) ≥ 0.81, "Leave one method" cross-test correlation coefficient (RCV2) ≥ 0.64 and external prediction correlation coefficient (Rtest2) ≥ 0.64, which are all higher than the standards mentioned in the literature[25]; 2) The ratio of various standard deviations (SD) to the value range (Vr) should be less than or equal to 10%[26]; 3) The absolute value of the prediction error for above 80% samples should be less than or equal to 2 times that of the standard deviation (2SD). The external prediction correlation coefficient (Rtest2) and standard deviation (SDtest) were calculated according to Eqs. (4) and (5), respectively.
R2test =1−∑testi=1(yi−ˆyi)2∑testi=1(yi−ˉyi)2 (4) SDtest=√1n−1⋅∑testi=1(yi−∧yi)2 (5) In equations (4) and (5), both yi and
ˆyi were the experimental and predicted values of the test set samples, respectively.ˉyi was the average of the experimental values of the test set samples.3. RESULTS AND DISCUSSION
The research samples contained only six types of atoms: H, C(sp)3, C(sp)2, C(sp), O(sp)3, and O(sp)2, thereby producing a total of 63 structural descriptors, including 21 electrostatic interaction terms, 21 stereoscopic interaction terms, and 21 hydrophobic interaction terms. Because there were too many structural descriptors, some structural descriptors may have little correlation with compound toxicity, so it was necessary to screen variables before modeling. The stepwise regression was used to screen variables which were introduced into the model for significance. By observing the changes of model correlation coefficient (R2), standard deviation (SD), cross-test correlation coefficient (RCV2), and standard deviation (SDCV), we selected the best combination of variables to build the model. When 7 variables x1, x18, x33, x72, x80, x118 and x127 (listed in Table 3) were selected, the correlation coefficient (R2), standard deviation (SD), cross-test correlation coefficient (RCV2) and standard deviation (SDCV) achieved ideal values at the same time. Among the selected variables, x1, x18 and x33 were electrostatic interaction terms, x72 and x80 were steric interaction terms, and x118 and x127 were hydrophobic interaction terms.
Table 3
No. x1 x18 x33 x72 x80 x118 x127 1 0.2630 0.3081 0.0000 9.4512 13.3881 2.5058 –39.5061 2 0.1657 0.1615 0.0000 9.4438 13.0792 1.8963 –38.3331 3 0.0698 0.0245 0.0000 9.4438 12.1325 1.6753 –49.8270 4 0.4206 0.2568 0.0000 9.4469 15.3234 1.6745 –49.7144 5 0.2680 0.1514 0.0000 9.4438 14.3071 1.6298 –45.1418 6* 0.4174 0.1914 0.0000 9.4469 19.9730 2.1067 –49.8103 7 0.3896 0.2575 0.0000 9.4438 14.5846 2.0875 –48.7584 8 0.1927 0.1684 0.0512 9.4438 10.3336 1.6976 –8.5252 9 0.5591 0.3334 0.0000 9.4395 19.2187 2.1008 –49.4027 10 0.2594 0.0676 0.0000 9.4469 13.5881 1.9412 –34.6710 11 0.4152 0.1653 0.0000 -0.0003 5.3267 2.1228 –61.1421 12* 0.3820 0.1936 0.0000 9.4469 13.7263 2.0957 –52.7547 13 0.1583 0.1061 0.0845 6.8120 3.1219 0.8706 –29.4123 14 0.4586 0.1943 0.0000 9.4457 14.9213 2.1556 –64.1180 15 0.2164 0.0710 0.0000 17.5580 9.1665 0.8051 –45.6454 16 0.5381 0.3592 0.0000 9.4438 14.0289 2.6582 –44.0449 17 0.5532 0.2670 0.0000 9.4469 14.8435 2.0998 –49.3409 18* 0.5207 0.1782 0.0000 9.4938 16.7599 1.9268 –10.8316 19 0.6781 0.3838 0.0000 9.4438 15.2826 2.4261 –51.0394 20 0.6598 0.2529 0.0000 9.4438 16.5778 1.5201 –31.6317 21 0.6572 0.2955 0.0000 9.4395 17.1701 2.1375 –40.1943 22 0.3111 0.1929 0.0814 9.4469 10.5921 1.9374 –38.9479 23 0.3240 0.1195 0.0000 17.5559 9.7247 1.1304 –5.9053 24* 0.6202 0.2145 0.0000 9.4457 15.9782 1.6753 –49.8270 25 0.6974 0.3212 0.0000 9.4438 15.6485 1.9338 –38.8962 26 0.5271 0.1581 0.0000 9.4438 12.1632 1.9373 –38.9466 27 0.5677 0.1454 0.0000 9.4438 14.7229 1.6755 –49.8563 28 0.7204 0.2281 0.0000 9.4395 16.9000 1.6298 –45.1417 29 0.7477 0.2267 0.0000 9.4438 18.8592 1.6757 –49.8691 30* 0.4712 0.1849 0.0000 17.5606 10.7128 1.7189 –62.1318 31 0.6710 0.2094 0.0000 9.4469 17.7720 2.2757 –50.5241 32 0.7266 0.2111 0.0000 9.4395 18.2193 1.7073 –8.5694 33 0.8912 0.2863 0.0000 9.4438 17.5452 1.7101 –8.5826 34 0.8137 0.2597 0.0000 9.4438 14.9115 2.1008 –49.3987 35 0.8998 0.2751 0.0000 9.4469 14.7182 1.5201 –31.6316 36* 0.8989 0.2102 0.0000 9.4438 19.7167 1.6299 –45.1410 37 0.8239 0.2281 0.0000 9.4438 14.7305 2.0523 –35.8980 38 0.8415 0.2828 0.0000 9.4438 13.5559 2.4284 –53.8515 39 0.9012 0.2218 0.0000 9.4499 13.0857 1.6625 –8.3638 40 1.0125 0.2792 0.0000 9.4438 13.5567 2.1621 –60.6598 41 1.0157 0.2399 0.0000 9.4499 13.5891 2.7693 –45.2683 42* 1.2021 0.2633 0.0000 9.4438 15.6672 2.6267 –83.5691 43 1.4141 0.3793 0.0000 9.4438 26.0487 2.3941 –14.7822 44 1.2429 0.3617 0.0000 9.4469 15.9724 3.0923 –63.8925 45 0.7323 0.1013 0.0000 9.4438 13.8681 5.9578 –68.1012 46 1.5014 0.2745 0.0000 9.4438 15.6676 0.3897 –18.0973 47 1.5707 0.3163 0.0000 9.4438 13.5576 0.5714 –44.5666 48* 1.7261 0.3412 0.0000 9.4469 14.7726 0.4994 –31.6074 7-variable multiple linear regression model (M1), as in Eq. (6).
log(1/IGC50)=–2.0424+2.7984x1–3.0006x18+6.2540x33+0.0491x72–0.0369x80+0.2897x118+0.0006x127 (6) N=40,R21=0.9974,SD1=0.0469,F1=1748.8673;R2CV1=0.9939,SDCV1=0.0715,FCV1=749.2740;R2test1=0.9955,SDtest1=0.0720 N was the number of regression points, R12 the correlation coefficient, SD1 the standard deviation, F1 the significance test value; RCV12 the correlation coefficient of the cross-test, SDCV1 the standard deviation of the cross-test, FCV1 the significance test value of the cross-test, Rtest12 the external test correlation and SDtest1 the standard deviation of the external test. The correlation coefficient (R12) of the above model was as high as 0.9974, much greater than the 0.81 standard, indicating that the model fit well; the value range (Vr) of the research samples was 1.8794 – (–1.6092) = 3.4886, and the standard deviation (SD1) was 0.0469, (0.0469/3.4886) × 100% = 1.3444%, much lower than the 10% standard, which meat the model fitting errors were small. The cross-test correlation coefficient (RCV12) was 0.9939 and much larger than the 0.64 standard; the cross-test standard deviation (SDCV1) was 0.0715, (0.0715/3.4886) × 100% = 2.0495%, which was much lower than the 10% standard, suggesting that the model was stable. The external test correlation coefficient (Rtest12) was 0.9955 and much greater than 0.64; the external test standard deviation (SDtest1) was 0.0720, (0.0720/3.4886) × 100% = 2.0639%, which was greatly lower than the 10% standard, indicating strong predictive ability and small prediction errors of the model.
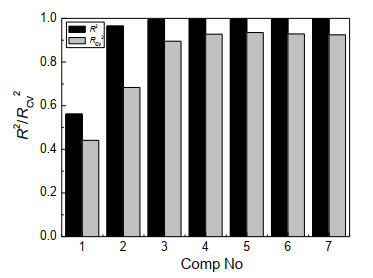
In order to further understand the influence of variables on compound toxicity, the structural descriptors in Table 2 were used as the independent variables X, and the compound toxicity value log(1/IGC50) as the dependent variable Y. The partial least-squares regression was used to establish a model (M2). The change of the correlation coefficients (R2/RCV2) with the number of principal components is shown in Fig. 2. When the number of the principal components reached 3, the correlation coefficient (R2) of the model got the maximum value, and the cross-test correlation coefficient (RCV2) was close to the maximum value. Thereafter, 3 principal components were chosen to build the model.
Figure 2
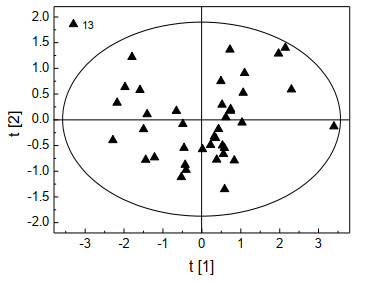
The distribution of the scores of the 40 training set samples in the top 2 principal components of the PLS space is plotted in Fig. 3. The scores of most of the studied samples (97.5%) fell within the 95% confidence elliptical confidence circle. There was only one abnormal point (compound No. 13), which reflected that the structural descriptors could represent the molecular structure characteristics of ester compounds and got the correct performance in the statistical model. The abnormal point in Fig. 3 is compound No. 13 "2-butynyl-acetate", which contained a "triple bond" and had a certain degree of particularity.
Figure 3
At this time, the model's R22 = 0.9940, SD2 = 0.0646; RCV22 = 0.8952, SDCV2 = 0.0925; Rtest22 = 0.9955, SDtest2 = 0.0716. The correlation coefficient (R22) of the model was as high as 0.9940, which was much larger than the 0.81 standard, indicating that the model fit well; the standard deviation (SD2) was 0.0646, (0.0646/3.4886) × 100% = 1.8517%, which was much lower than the 10% standard, so the model fitting errors were small. The cross test correlation coefficient (RCV22), 0.8952, was much larger than the 0.64 standard; the cross test standard deviation (SDCV2) was 0.0925, (0.0925/3.4886) ×100% = 2.6515% and greatly lower than the 10% standard, which suggested stability for the model. The external test correlation coefficient (Rtest22) of 0.9955 was remarkably greater than 0.64; the external test standard deviation (SDtest2) was 0.0716, (0.0716/3.4886) × 100% = 2.0524%. It was significantly lower than the 10% standard, also showing that the model had strong predictive ability and the prediction errors were small.
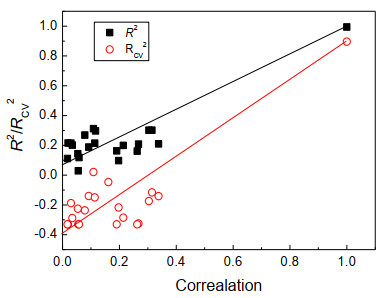
In order to verify whether the excellent model results were accidental, the model was verified by random sorting of the Y vector 20 times. The correlation coefficients of the Y original vector and the randomly sorted Y vector are plotted on the model R2 and RCV2 in Fig. 4. According to the judgment criteria proposed by Andersson et al.[27], the intercepts of R2 and RCV2 on the vertical axis should not exceed 0.300 and 0.050, respectively. From Fig. 4, it can be found that the intercepts of R2 and RCV2 of the PLS model built in this paper were 0.072 and –0.400, respectively. Therefore, it could be considered that the excellent results of the model built in this paper were not accidental, so our model could be used to analyze the structures of ester compounds.
Figure 4
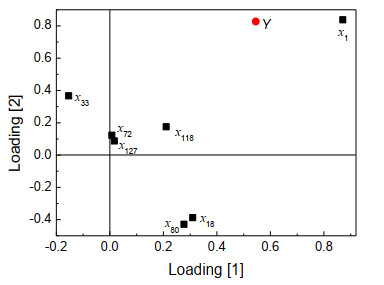
In order to further study the influence of each variable on the compound toxicity log(1/IGC50)(Y), the load distribution of the samples in PLS is plotted in Fig. 5, in which x1, x72, x118, and x127 are in the upper right. It means that they are positively correlated with Y in the first and second principal components, and the distance between x1 and the origin is relatively large, which reflects that it has a relatively larger correlation with Y. x18 and x80 are at the bottom right of the figure, indicating that they are positively correlated with Y in the first principal component, and negatively correlated with Y in the second principal component. x33 is at the upper left of the figure, which suggests that it is negatively correlated with Y in the first principal component, and positively correlated with Y in the second principal component.
Figure 5
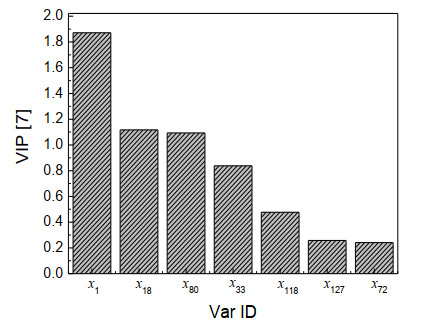
The importance of a variable can reflect the degree of correlation between the variable and Y. It is generally considered that variables with variable importance projection (VIP) values greater than 1 are highly correlated with the toxicity log(1/IGC50) of ester compounds. The variable importance projection is shown in Fig. 6. Fig. 6 shows that the VIP values of the three variables x1, x18, and x80 were greater than 1, indicated that these three variables were highly correlated with the toxicity log(1/IGC50) of ester compounds. x1 corresponding to the electrostatic interaction of hydrogen atoms, described that the more hydrogen atoms in the compound, the higher the toxicity log(1/IGC50) value of the ester compound may be. x18 corresponding to the electrostatic effect of C(sp)3 and O(sp)2, and x80 corresponding to the stereoscopic interaction effect of C(sp)2 and O(sp)3. The above shows that oxygen atoms had a greater influence on the toxicity value.
Figure 6
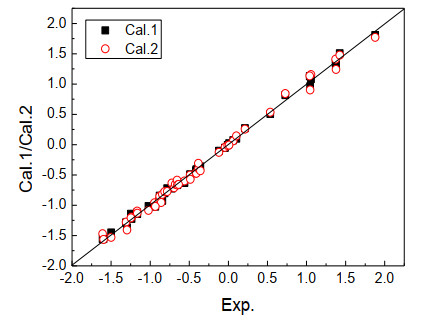
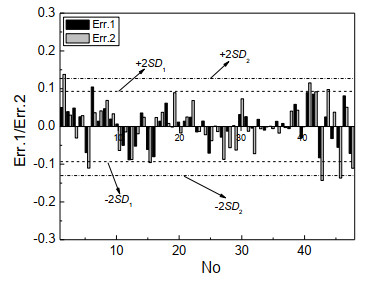
The calculated values of the toxicity log(1/IGC50) of the two models for the compounds are listed in Table 1 as Cal.1 and Cal.2, Err.1 and Err.2 are the errors, respectively. For the convenience of observation, the correlation between the calculated log(1/IGC50) of the model's toxicity to the compound and the experimental values is plotted in Fig. 7, and the corresponding errors are plotted in Fig. 8. Fig. 7 shows that most of the sample points were near the 45° diagonal, indicating that the calculated values of the model's toxicity log(1/IGC50) for the compounds were highly correlated with the experimental values. The two values were close in size. The toxicity log(1/IGC50) could be predicted accurately, which once again showed the model's good predictive ability and excellent predictive results.
Figure 7
Figure 8
A good prediction model usually requires the prediction errors of most samples not exceeding plus or minus 2 times that of the standard deviation (ie ± 2SD). It can be found in Fig. 8 that most of the samples' errors were within ± 2SD of the model. For model M1, only 1 sample (No. 1) had a prediction error exceeding ± 2SD1; for model M2, only 3 samples (Nos. 1, 43, 46) had prediction errors larger than ± 2SD2. This shows that the model was accurate in predicting the toxicity log(1/IGC50) of the compounds, and the prediction errors were in an acceptable range. The model could be used to predict the toxicity log(1/IGC50) of ester compounds. At the same time, the existence of large error samples indicated that some special structural information of compounds had not been fully expressed, and the molecular structure characterization method needed further improvement.
4. CONCLUSION
By classifying the atoms in the compound, the electrostatic interaction, steric interaction and hydrophobic interaction between the atoms were calculated as structural descriptors on the three-dimensional structure of the compound, and then the structures of 48 ester compounds were expressed parametrically. The relationship models between compound structures and toxicity log(1/IGC50) were established through multiple linear regression (MLR) and partial least-squares regression (PLS), and it was found that the toxicity of ester compounds log(1/IGC50) was closely related to the molecular structures of the compounds. The constructed structure-toxicity log(1/IGC50) relationship models can be used to predict the toxicity log(1/IGC50) of ester compounds. Due to the slightly larger prediction errors of individual samples, there is still a lot of room for improvement in the molecular structure characterization method, and related researches are underway. This paper has certain reference value for the quantitative structure-toxicity relationship study of toxic compounds in environment.
-

-
-
[1]
Gaofeng WANG , Shuwen SUN , Yanfei ZHAO , Lixin MENG , Bohui WEI . Structural diversity and luminescence properties of three zinc coordination polymers based on bis(4-(1H-imidazol-1-yl)phenyl)methanone. Chinese Journal of Inorganic Chemistry, 2024, 40(5): 849-856. doi: 10.11862/CJIC.20230479
-
[2]
Yongqing Kuang , Jie Liu , Jianjun Feng , Wen Yang , Shuanglian Cai , Ling Shi . Experimental Design for the Two-Step Synthesis of Paracetamol from 4-Hydroxyacetophenone. University Chemistry, 2024, 39(8): 331-337. doi: 10.12461/PKU.DXHX202403012
-
[3]
Yi DING , Peiyu LIAO , Jianhua JIA , Mingliang TONG . Structure and photoluminescence modulation of silver(Ⅰ)-tetra(pyridin-4-yl)ethene metal-organic frameworks by substituted benzoates. Chinese Journal of Inorganic Chemistry, 2025, 41(1): 141-148. doi: 10.11862/CJIC.20240393
-
[4]
Hyoseok Kim , Changyi Cui , Kohei Toh , Genyir Ado , Tetsuya Ogawa , Yixin Zhang , Shin-ichi Sato , Yong-Beom Lim , Hiroki Kurata , Lu Zhou , Motonari Uesugi . Discovery of a self-assembling small molecule that sequesters RNA-binding proteins. Chinese Chemical Letters, 2025, 36(5): 110135-. doi: 10.1016/j.cclet.2024.110135
-
[5]
Jingzhao Cheng , Shiyu Gao , Bei Cheng , Kai Yang , Wang Wang , Shaowen Cao . 4-氨基-1H-咪唑-5-甲腈修饰供体-受体型氮化碳光催化剂的构建及其高效光催化产氢研究. Acta Physico-Chimica Sinica, 2024, 40(11): 2406026-. doi: 10.3866/PKU.WHXB202406026
-
[6]
Yahui HAN , Jinjin ZHAO , Ning REN , Jianjun ZHANG . Synthesis, crystal structure, thermal decomposition mechanism, and fluorescence properties of benzoic acid and 4-hydroxy-2, 2′: 6′, 2″-terpyridine lanthanide complexes. Chinese Journal of Inorganic Chemistry, 2025, 41(5): 969-982. doi: 10.11862/CJIC.20240395
-
[7]
Bairu Meng , Zongji Zhuo , Han Yu , Sining Tao , Zixuan Chen , Erik De Clercq , Christophe Pannecouque , Dongwei Kang , Peng Zhan , Xinyong Liu . Design, synthesis, and biological evaluation of benzo[4,5]thieno[2,3-d]pyrimidine derivatives as novel HIV-1 NNRTIs. Chinese Chemical Letters, 2024, 35(6): 108827-. doi: 10.1016/j.cclet.2023.108827
-
[8]
Yinling HOU , Jia JI , Hong YU , Xiaoyun BIAN , Xiaofen GUAN , Jing QIU , Shuyi REN , Ming FANG . A rhombic Dy4-based complex showing remarkable single-molecule magnet behavior. Chinese Journal of Inorganic Chemistry, 2025, 41(3): 605-612. doi: 10.11862/CJIC.20240251
-
[9]
Yu Pang , Min Wang , Ning-Hua Yang , Min Xue , Yong Yang . One-pot synthesis of a giant twisted double-layer chiral macrocycle via [4 + 8] imine condensation and its X-ray structure. Chinese Chemical Letters, 2024, 35(10): 109575-. doi: 10.1016/j.cclet.2024.109575
-
[10]
Ran Wu , Dongxu Jiang , Hao Hu , Chenyu Yang , Liang Qin , Lulu Chen , Zehui Hu , Hualei Xu , Jinrong Li , Haiqiang Liu , Hua Guo , Jinxiang Fu , Qichen Hao , Yijun Zhou , Jinchao Feng , Qiang Wang , Xiaodong Wang . 4-Aminoazobenzene: A novel negative ion matrix for enhanced MALDI tissue imaging of metabolites. Chinese Chemical Letters, 2024, 35(11): 109624-. doi: 10.1016/j.cclet.2024.109624
-
[11]
Jing LIANG , Qian WANG , Junfeng BAI . Synthesis and structures of cdq-topological quaternary and (4, 4, 8)-c topological quinary Zn-MOFs with both oxalic acid and triazole ligands. Chinese Journal of Inorganic Chemistry, 2024, 40(11): 2186-2192. doi: 10.11862/CJIC.20240177
-
[12]
Hong-Tao Ji , Yu-Han Lu , Yan-Ting Liu , Yu-Lin Huang , Jiang-Feng Tian , Feng Liu , Yan-Yan Zeng , Hai-Yan Yang , Yong-Hong Zhang , Wei-Min He . Nd@C3N4-photoredox/chlorine dual catalyzed synthesis and evaluation of antitumor activities of 4-alkylated sulfonyl ketimines. Chinese Chemical Letters, 2025, 36(2): 110568-. doi: 10.1016/j.cclet.2024.110568
-
[13]
Lu LIU , Huijie WANG , Haitong WANG , Ying LI . Crystal structure of a two-dimensional Cd(Ⅱ) complex and its fluorescence recognition of p-nitrophenol, tetracycline, 2, 6-dichloro-4-nitroaniline. Chinese Journal of Inorganic Chemistry, 2024, 40(6): 1180-1188. doi: 10.11862/CJIC.20230489
-
[14]
Hualei Xu , Manman Han , Haiqiang Liu , Liang Qin , Lulu Chen , Hao Hu , Ran Wu , Chenyu Yang , Hua Guo , Jinrong Li , Jinxiang Fu , Qichen Hao , Yijun Zhou , Jinchao Feng , Xiaodong Wang . 4-Nitrocatechol as a novel matrix for low-molecular-weight compounds in situ detection and imaging in biological tissues by MALDI-MSI. Chinese Chemical Letters, 2024, 35(6): 109095-. doi: 10.1016/j.cclet.2023.109095
-
[15]
Xiaofei NIU , Ke WANG , Fengyan SONG , Shuyan YU . Self-assembly of [Pd6(L)4]8+-type macrocyclic complexes for fluorescent sensing of HSO3-. Chinese Journal of Inorganic Chemistry, 2024, 40(7): 1233-1242. doi: 10.11862/CJIC.20240057
-
[16]
Ying Li , Long-Jie Wang , Yong-Kang Zhou , Jun Liang , Bin Xiao , Ji-Shen Zheng . An improved installation of 2-hydroxy-4-methoxybenzyl (iHmb) method for chemical protein synthesis. Chinese Chemical Letters, 2024, 35(5): 109033-. doi: 10.1016/j.cclet.2023.109033
-
[17]
Zhixiang Li , Zhirong Yang , Chang Yao , Bin Wu , Gang Qian , Xuezhi Duan , Xinggui Zhou , Jing Zhang . Efficient continuous synthesis of 2-hydroxycarbazole and 4-hydroxycarbazole in a millimeter scale photoreactor. Chinese Chemical Letters, 2024, 35(4): 108893-. doi: 10.1016/j.cclet.2023.108893
-
[18]
Juanjuan Wang , Fang Wang , Bin Qin , Yue Wu , Huan Yang , Xiaolong Li , Lanfang Wang , Xiufang Qin , Xiaohong Xu . Controlled synthesis and excellent magnetism of ferrimagnetic NiFe2Se4 nanostructures. Chinese Chemical Letters, 2024, 35(11): 109449-. doi: 10.1016/j.cclet.2023.109449
-
[19]
Shuwen SUN , Gaofeng WANG . Design and synthesis of a Zn(Ⅱ)-based coordination polymer as a fluorescent probe for trace monitoring 2, 4, 6-trinitrophenol. Chinese Journal of Inorganic Chemistry, 2025, 41(4): 753-760. doi: 10.11862/CJIC.20240399
-
[20]
Yi Zhou , Wei Zhang , Rong Fu , Jiaxin Dong , Yuxuan Liu , Zihang Song , Han Han , Kang Cai . Self-assembly of two pairs of homochiral M2L4 coordination capsules with varied confined space using Tröger's base ligands. Chinese Chemical Letters, 2025, 36(2): 109865-. doi: 10.1016/j.cclet.2024.109865
-
[1]
Metrics
- PDF Downloads(3)
- Abstract views(879)
- HTML views(5)

 Login In


 DownLoad:
 DownLoad: