Table 1.
Structures and Bioactivity Data of the Compounds in the Dataset
Citation:
Zhen ZHANG, Ping CHENG, Yuan-Zheng ZHU, Qiang XIA, Shu-Ping ZHANG. 3D-QSAR Analysis of a Series of 1, 2, 3-Triazole-chromenone Derivatives as an Acetylcholinesterase Inhibitor against Alzheimer's Disease[J]. Chinese Journal of Structural Chemistry,
2020, 39(7): 1235-1242.
doi:
10.14102/j.cnki.0254–5861.2011–2570

3D-QSAR Analysis of a Series of 1, 2, 3-Triazole-chromenone Derivatives as an Acetylcholinesterase Inhibitor against Alzheimer's Disease
English
3D-QSAR Analysis of a Series of 1, 2, 3-Triazole-chromenone Derivatives as an Acetylcholinesterase Inhibitor against Alzheimer's Disease
Abstract:
Chromenones have attracted much attention since they are excellent acetylcholinesterase inhibitor (AChEi). The 1, 2, 3-triazoles are multifunctional anti-acetylcholinesterase (AChE) agents. In this paper, we report the three-dimensional quantitative structure-activity relationship (3D-QSAR) study of 25 1, 2, 3-triazole-chromenone derivatives based comparative molecular field analysis (CoMFA) and comparative molecular similarity indices analysis (CoMSIA). To construct CoMFA and CoMSIA models, the 25 active molecules were randomly divided into the training and test sets. The obtained cross-validation Q2 of the CoMFA model, the coefficient of non-cross-validation R2, and the test value F are 0.597, 0.994, and 396.726, respectively. The cross-validation Q2 of the CoMSIA model, the coefficient of the non-cross-validation R2, and the test value F are 0.721, 0.979, and 131.107, respectively. The predictive correlation coefficient (rpred2) is 0.728 for CoMFA and 0.805 for CoMSIA, which verifies that the model is predictable. Based on the potential maps of CoMFA and CoMSIA, a library containing a set of potent AChEi was designed. The inhibitory potential of the compounds in this library was found to be greater than the inhibitory potential of the most active compounds in the data set. The results obtained from this study laid the foundation for the development of effective drugs for AChEi.
-
Key words:
- alzheimer's disease
- / 3D-QSAR
- / acetylcholinesterase inhibitor
- / 1
- / 2
- / 3-triazole-chromenone derivatives
-
1. INTRODUCTION
Alzheimer's disease (AD) is a typical representative of neurodegenerative diseases. It has become the most common cause of dementia in the elderly, and it is also a common cause of disability in individuals over 65 years of age[1]. AD is a very complex neurological disease that is affected by many factors. Over the years, in order to understand the pathogenesis of AD, scientists have proposed a variety of hypotheses, including the cholinergic damage hypothesis[2], Tau protein hypothesis[3], metal ion homeostasis imbalance hypothesis[4], β-amyloid protein cascade hypothesis[5], neuro-inflammation hypothesis[6], genetic inheritance hypothesis[7], oxidative stress hypothesis[8] and so on. The most typical of them is the central cholinergic damage hypo- thesis, which considers acetylcholine (ACh) as an important chemical substance in the nervous system. When AD disease occurs, the synthesis, storage and release of ACh are reduced by the reduction of cholinergic neurons in the brain. This leads to major clinical manifestations such as memory degradation and recognition of dysfunction. Therefore, maintaining and restoring Ach levels can alleviate the symptoms of AD disease[9, 10]. Acetylcholine inhibitors (AChi) play a role in the treatment of AD by inhibiting the activity of AChE, delaying the rate of ACh hydrolysis, and increasing the level of ACh in the synaptic cleft[11]. Thus, AChEIs are involved in a wide range of AD drug discovery studies[12].
Chromenone is a chemical compound which has a benzene ring and a six-membered heterocyclic compound with an oxygen hetero atom. Chromenones themselves have low value for treating AD, but some of their derivatives have been found to be key scaffolds for optimal AChEI activity in the interaction with CAS and PAS of AChE. In recent years, chromenon derivatives have been the most promising AChEi[13]. Apart from chromenones, 1, 2, 3-trrizoles have been considered as versatile anti-AChE agents[14]. In recent years, it has been reported that many scientists have focused on the combination of the two structures, hoping to obtain excellent AChEi.
Therefore, we retrieved a series of new 1, 2, 3-triazole-chromenone derivatives according to the Arezoo Rastegari team and Mina Saeedi team[15, 16], and recorded the activity of them as AChEi. we attempted to illuminate the structure-activity relationships (SARs) to provide useful guidelines for the design of new 1, 2, 3-triazole-chromenone derivatives as potent AChEIs, which are based on the established 3D-QSAR comparative molecular field analysis (CoMFA) and comparative molecular similarity indices analysis (CoMSIA) models for a series of disclosed triazole-chromenone analogues.
2. MATERIALS AND METHODS
2.1 Preparation of biologically active molecular data sets
The datasets of 25 1, 2, 3-triazole-chromenone derivatives for 3D-QSAR analysis were derived from two papers[15, 16] and the molecular activity assays were consistent. First, we convert the half maximal inhibitory concentration (IC50) values to the pIC50 (–log10(IC50)) values. The obtained pIC50 values ranging between 3.989 and 5.745 were used as response variables for subsequent 3D-QSAR analyzes. The 25 molecules were randomly divided into training sets (20) to construct CoMFA and CoMSIA models and test sets (5) to test the credibility of the model. All compound structures and their IC50 are listed in Table 1. The 3D structures of 1, 2, 3-triazole-chromenone derivatives were established using standard geometric parameters of molecular modeling software package SYBYL-X 2.0. At first, all compounds must be cleaned and optimized. We used the Powell conjugate gradient algorithm with a convergence criterion of 0.01 kcal/mol Å to perform energy minimization in the Tripos force field with a distance-dependent dielectric. Partial atomic charges were calculated by the Gasteiger-Hückel method[17-20].
Table 1

 DownLoad:
CSV
DownLoad:
CSV

Sr.no Compound numbers X Ar Experimental
pIC50Predicted pIC50 CoMFA Residue CoMSIA Residue 1 1a - H 5.347 5.299 –0.048 5.339 –0.008 2** 1b - 3, 4-Me 5.745 5.732 –0.013 5.817 0.072 3 1c - 2-Me 5.432 5.442 0.010 5.404 –0.028 4 1d - 2-Br 5.483 5.521 0.038 5.549 0.066 5 1e - 2-Cl 5.481 5.497 0.016 5.393 –0.088 6 1f - 3, 4-Cl 5.690 5.695 0.005 5.657 –0.033 7 1g - 4-F 4.996 4.992 –0.004 5.013 0.017 8 2a - 4-Me 4.361 4.356 –0.005 4.447 0.086 9 2b - 2-Me 5.007 5.013 0.006 5.043 0.036 10 2c - 2-Br 5.678 5.605 –0.073 5.584 –0.094 11 2d - 2, 3-Cl 5.298 5.360 0.062 5.398 0.100 12* 2e - 3, 4-Cl 3.989 4.700 0.711 4.576 0.587 13* 2f - 4-Cl 4.532 4.676 0, 144 4.591 0.059 14 2g - 3-Cl 4.790 4.722 –0.068 4.666 –0.124 15 2h - 4-F 4.790 4.827 0.037 4.776 –0.014 16 2i - 3-F 4.648 4.684 0.036 4.662 0.014 17* 3a H 3-F 4.318 4.758 0.440 4.716 0.398 18 3b H 2-Cl 4.469 4.449 –0.020 4.459 –0.010 19* 3c H 2, 3-Cl 4.694 4.730 0.036 4.694 0.000 20 3d H 3, 4-Cl 4.777 4.806 0.029 4.754 –0.023 21* 3e H 2-Br 4.508 4.635 0.127 4.601 0.093 22 3f OMe 2-Me 4.618 4.625 0.007 4.688 0.070 23 3g OMe 2-Cl 4.812 4.805 –0.007 4.758 –0.054 24 3h OMe 2, 3-Cl 4.472 4.501 0.029 4.553 0.081 25 3i OMe 3, 4-Cl 4.593 4.556 –0.037 4.528 –0.065 * Represents molecules in the test set;
**Represents the most active inhibitor;
CoMFA, comparative molecular field analysis;
CoMSIA, comparative molecular similarity indices analysis2.2 Molecular modelling and alignment
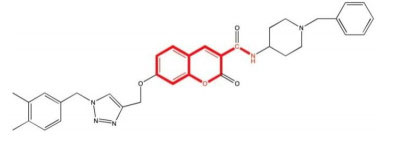
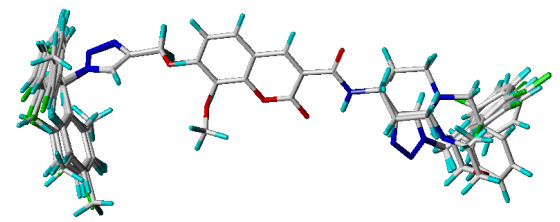
The 3D structure alignment is an important factor that significantly affects the results of 3D-QSAR studies. Various different alignment strategies have been well described in the literature[21, 22]. The alignment rules determine the quality and predictability of the established model. Typically, one of the following is used as the template molecule: (a) the lead and/or commercial compound, (b) the most active compound, and (c) the compound having the most functional groups. In this study, we obtained the global minimum-energy conformation of the most active inhibitor 2 and used it as a template molecule, which was then aligned with the rigid body of ALIGN DATABASE to align the geometrically optimized molecules. Fig. 1 shows the structure of compound 2 with the largest common substructure. It can be observed that all compounds in this study have similar active conformations (Fig. 2).
Figure 1
 Figure 1. Public skeleton structure
Figure 2
 Figure 2. Alignment of the molecules in the dataset
2.3 Partial least-squares analysis
To calculate the size and distribution of the steric and electrostatic fields at each grid point around the overlapping molecules, we decided to use the Tripos force field. At the same time, we use sp3 carbon having a +1 charge as the probe atom, and the rest of the parameters were the system defaults[23-25]. In partial least-squares (PLS) analysis, firstly, the leave-one-out (LOO) was used for cross-validation to obtain the optimal number of components (ONC). After determining the optimal number of components, non-cross-validation analysis was performed using column filtration. The cross-validation correlation coefficient Q2, predicted residual sum of squares (PRESS), non-cross-validated correlation coefficient rncv2 and standard standard error (SEE) value were calculated. The correlation coefficient of cross-validation was also calculated using the following equation[26]:
$ \mathrm{Q}^2=1-\left[\Sigma\left(\mathrm{y}_{\text {predicted }}-\mathrm{y}_{\text {observed }}\right)^2 / \Sigma\left(\mathrm{y}_{\text {observed }}-\mathrm{y}_{\text {mean }}\right)^2\right]$ Where ypredicted, yobserved and ymean are the predicted, observed, and mean activity values, respectively. After calculating Q2, the calculation of rpred2 is also indispensable, because external verification using data outside the training set is considered to be the only method to guarantee the prediction ability of the QSAR model. The calculation formula of rpred2 is as follows[27]:
$\mathrm{r}_{\text {pred }}{ }^2=1-(\mathrm{PRESS} / \mathrm{SD}) $ Where SD represents the sum of the squared deviations between the biological activity of the test group compound and the average activity of the training one, and PRESS is the sum of the squared deviations between the experimental activity and the predicted activity of the test group compound, respectively.
3. RESULTS AND DISCUSSION
3.1 Test the reliability of the model
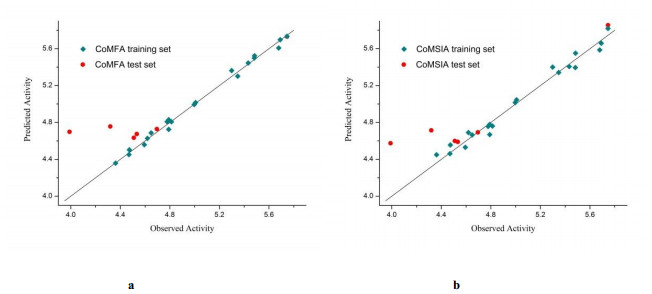
PLS analysis results of the CoMFA and CoMSIA are listed in Table 2. It is reported that the model is excellent and has good predictive power if Q2 is greater than 0.5 and rpred2 is higher than 0.6[28, 29]. In this study, the calculated Q2 is 0.597 for CoMFA model and 0.721 for CoMSIA model, and the calculated rpred2 for the CoMFA and CoMSIA models is 0.728 and 0.805, respectively. These results indicate that both these two models have good predictive power. In order to further verify the predictability of these two models, we use the model trained by the training set to predict the test set. Fig. 3 shows that the linear correlation between the experimental and predicted activities of all molecules is very great. The residue between the predicted and experimental pIC50 values is within the tolerable range, and the correlation between the two values is also great, which further verified that both CoMFA and CoMSIA have excellent predictive power.
Table 2
Table 2. Summary of Partial Least-squares (PLS) ResultsDownLoad:
CSV
Parameters PLS results CoMFA CoMSIA Q2 (cross-validated) 0.597 0.721 rpred2 (test) 0.728 0.805 PRESS 0.737 0.528 SD 2.708 2.708 Standard error of estimate 0.043 0.076 Optimum number of components 6 5 rncv2 (non-cross-validated) 0.994 0.979 Test value 346.726 131.107 Steric field contribution 0.609 0.148 Electrostatic field contribution 0.391 0.261 Hydrophobic field contribution - 0.569 Hydrogen bond donor field contribution - 0.021 Hydrogen bond acceptor field contribution - 0 Figure 3
 Figure 3. Scatterplot of experimental versus predicted pIC50 by comparative molecular field analysis (CoMFA) (a) and comparative molecular similarity indices analysis (CoMSIA) (b)
3.2 3D-QSAR contour maps
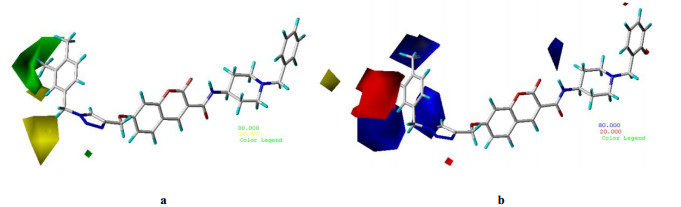
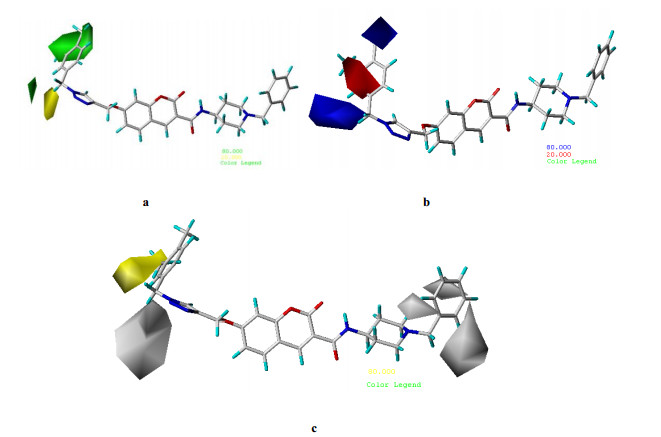
The field distribution of the models could be seen from the 3D-QSAR contour maps. The steric and electrostatic contour maps around reference molecule 2 of the CoMFA and CoMSIA models are shown in Figs. 4, 5(a) and 5(b). CoMFA and CoMSIA steric contour maps are displayed in Fig. 4(a) and 5(a). The green color block shows that increasingly the steric hindrance of substituent in this region can enhance the molecular activity, and the yellow color block means that reducing the steric hindrance of the substituent in this region can enhance the molecular activity. For example, molecule 2 exhibits higher anti-AD activity than molecule 3, mainly because it exhibited a larger steric hindrance than 3 at the 3rd position of the benzene ring. This means that the introduction of bulky groups at this position will be beneficial for anti-AD efficacy. CoMFA and CoMSIA electrostatic contour maps are represented in Fig. 4(b) and 5(b). Blue and red represent favorable and unfavorable regions for electrostatic field. As shown in Fig. 4(b) and 5(b), the 2nd and 3rd positions on the benzene ring are surrounded by red color blocks, and the blue color blocks are wrapped around the 4th position on the benzene ring, which indicates that the addition of negatively charged groups in the 2nd and 3rd positions favors molecular activity, but the 4th position is exactly opposite. For example, under the same conditions of basic skeleton, the activity of molecule 11 is significantly greater than the activity of molecule 12. The reason for this phenomenon is because the "Cl" atoms in the 2nd and 3rd positions of compound 11 are negatively charged, while the 4th position of molecule 12 has a "Cl", which increases the negative charge of the 4th position on the benzene ring. Hydrogen bond donors and acceptors have the lowest contribution to molecular activity, so we omitted the analysis of their contour map.
Figure 4
 Figure 4. Contour maps of the CoMFA models
Figure 5
 Figure 5. Contour maps of the CoMSIA models
4. DESIGN OF NEW DRUGS
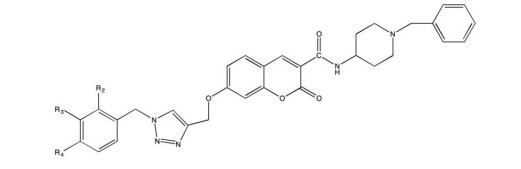
Fig. 6 is a predicted molecular template. According to Table 2, the contribution of the steric field is greater than that of the electrostatic field for both the CoMFA and CoMSIA models, which indicates that the activity of the drug molecule is mainly affected by the size and steric hindrance of the substituent, so we designed the N1 (CoMFA: 5.962, CoMSIA: 5.542) and N2 (CoMFA: 5.743, CoMSIA: 5.841) molecules. They replace the methyl group at the R3 position with a methoxy group and an ethyl group respectively, and their pharmacological activity was predicted based on the model. The predicted activity of the two molecules is significantly increased by comparison with the activity of the most active compound 2. Besides the steric field, the hydrophobicity also plays a large role in the CoMSIA model. According to Fig. 5(c), replacing a hydrophobic group at the R3 position can increase the molecular activity, and then based on this 3D-QSAR hydrophobic field we designed N3 (CoMFA: 5.801, CoMSIA: 5.890) and N4 (CoMFA: 5.770, CoMSIA: 6.064).
Figure 6
 Figure 6. Template for predicting the molecules
Table 3
Table 3. Predictive Activity of the Designed Small Molecules Based on CoMFA and CoMSIA ModelsDownLoad:
CSV
Compound_ ID Compound_ structure CoMFA CoMSIA N1 
5.962 5.542 N2 
5.743 5.841 N3 
5.801 5.890 N4 
5.760 6.064 5. CONCLUSION
In this study, 25 structurally related 1, 2, 3-triazole-chromenone derivatives from the literature were selected for 3D-QSAR analysis. Through the analysis of the 3D-QSAR contour maps generated by SYBYL-X 2.0 software, the main relevant structural conclusions of this study are as follows: (i) The large population of R3 in Fig. 6 is more favorable for anti-AD efficacy than the small population; (ii) the compound having a halogen group at the R3 position is more active than the derivative without it in Fig. 6. Then, the cross-validation was conducted to obtain high predictive and satisfactory CoMFA model (Q2 = 0.597, R2 = 0.994) and CoMSIA model (Q2 = 0.721, R2 = 0.979), the essential external verification (rpred2 = 0.728, 0.805 for CoMFA and CoMSIA) shows that the model has significant predictive effects.
-
-
[1]
Bolos, M.; Perea, J. R.; Avila, J. Alzheimer's disease as an inflammatory disease. Biomol. Concepts 2017, 8, 37–43. doi: 10.1515/bmc-2016-0029
-
[2]
Bartus, R. T.; Dean, R. L.; Beer, B.; Lippa, A. S. The cholinergic hypothesis of geriatric memory dysfunction. Science (New York, N. Y. ) 1982, 217, 408–14. doi: 10.1126/science.7046051
-
[3]
Iqbal, K.; Alonso, A. D. C.; Chen, S.; Chohan, M. O.; El-Akkad, E.; Gong, C. X.; Khatoon, S.; Li, B.; Liu, F.; Rahman, A.; Tanimukai, H.; Grundke-Iqbal, I. Tau pathology in Alzheimer disease and other tauopathies. BBA-Molecular Basis of Disease 2005, 1739, 198–210. doi: 10.1016/j.bbadis.2004.09.008
-
[4]
Bush, A. I. Metals and neuroscience. Curr. Opin. Chem. Biol. 2000, 4, 184–191. doi: 10.1016/S1367-5931(99)00073-3
-
[5]
Hardy, J. A.; Higgins, G. A. Alzheimer's disease: the amyloid cascade hypothesis. Science (New York, N. Y. ) 1992, 256, 184–5. doi: 10.1126/science.1566067
-
[6]
Finch, C. E.; Morgan, T. E. Systemic inflammation, infection, apoE alleles, and Alzheimer disease: a position paper. Curr. Alzheimer Res. 2007, 4, 185–189. doi: 10.2174/156720507780362254
-
[7]
Bird, T. D. Genetic factors in Alzheimer's disease. N. Engl. J. Med. 2005, 352, 862–864. doi: 10.1056/NEJMp058027
-
[8]
Pratico, D. Oxidative stress hypothesis in Alzheimer's disease: a reappraisal. Trends Pharmacol. Sci. 2008, 29, 609–615. doi: 10.1016/j.tips.2008.09.001
-
[9]
Xie, Q.; Wang, H.; Xia, Z.; Lu, M.; Zhang, W.; Wang, X.; Fu, W.; Tang, Y.; Sheng, W.; Li, W.; Zhou, W.; Zhu, X.; Qiu, Z.; Chen, H. Bis-(-)-nor-meptazinols as novel nanomolar cholinesterase inhibitors with high inhibitory potency on amyloid-beta aggregation. J. Med. Chem. 2008, 51, 2027–2036. doi: 10.1021/jm070154q
-
[10]
Munoz-Torrero, D. Acetylcholinesterase inhibitors as disease-modifying therapies for alzheimer's disease. Curr. Med. Chem. 2008, 15, 2433–2455. doi: 10.2174/092986708785909067
-
[11]
Bartolucci, C.; Haller, L. A.; Jordis, U.; Fels, G.; Lamba, D. Probing torpedo californica acetylcholinesterase catalytic gorge with two novel bis-functional galanthamine derivatives. J. Med. Chem. 2010, 53, 745–751. doi: 10.1021/jm901296p
-
[12]
Pohanka, M. Acetylcholinesterase inhibitors: a patent review (2008-present). Expert Opin. Ther. Pat. 2012, 22, 871–886. doi: 10.1517/13543776.2012.701620
-
[13]
Anand, P.; Singh, B.; Singh, N. A review on coumarins as acetylcholinesterase inhibitors for Alzheimer's disease. Bioorg. Med. Chem. 2012, 20, 1175–1180. doi: 10.1016/j.bmc.2011.12.042
-
[14]
Lewis, W. G.; Green, L. G.; Grynszpan, F.; Radic, Z.; Carlier, P. R.; Taylor, P.; Finn, M. G.; Sharpless, K. B. Click chemistry in situ: acetylcholinesterase as a reaction vessel for the selective assembly of a femtomolar inhibitor from an array of building blocks. Angew. Chem. Int. Ed. 2002, 41, 1053. doi: 10.1002/1521-3773(20020315)41:6<1053::AID-ANIE1053>3.0.CO;2-4
-
[15]
Rastegari, A.; Nadri, H.; Mahdavi, M.; Moradi, A.; Mirfazli, S. S.; Edraki, N.; Moghadam, F. H.; Larijani, B.; Akbarzadeh, T.; Saeedi, M. Design, synthesis and anti-Alzheimer's activity of novel 1, 2, 3-triazole-chromenone carboxamide derivatives. Bioorg. Chem. 2019, 83, 391–401. doi: 10.1016/j.bioorg.2018.10.065
-
[16]
Saeedi, M.; Safavi, M.; Karimpour-Razkenari, E.; Mahdavi, M.; Edraki, N.; Moghadam, F. H.; Khanavi, M.; Akbarzadeh, T. Synthesis of novel chromenones linked to 1, 2, 3-triazole ring system: investigation of biological activities against Alzheimer's disease. Bioorg. Chem. 2017, 70, 86–93. doi: 10.1016/j.bioorg.2016.11.011
-
[17]
Dixon, S. L.; Smondyrev, A. M.; Knoll, E. H.; Rao, S. N.; Shaw, D. E.; Friesner, R. A. PHASE: a new engine for pharmacophore perception, 3D QSAR model development, and 3D database screening: 1. Methodology and preliminary results. J. Comput. Aided Mol. Des. 2006, 20, 647–671. doi: 10.1007/s10822-006-9087-6
-
[18]
Fang, Y.; Lu, Y.; Zang, X.; Wu, T.; Qi, X.; Pan, S.; Xu, X. 3D-QSAR and docking studies of flavonoids as potent Escherichia coli inhibitors. Sci. Rep. 2016, 6, 23634. doi: 10.1038/srep23634
-
[19]
Liu, X. H.; Xu, X. Y.; Tan, C. X.; Weng, J. Q.; Xin, J. H.; Chen, J. Synthesis, crystal structure, herbicidal activities and 3D-QSAR study of some novel 1, 2, 4-triazolo 4, 3-a pyridine derivatives. Pest Manage. Sci. 2015, 71, 292–301. doi: 10.1002/ps.3804
-
[20]
Yang, Q.; Zhang, S. P.; Zhao, S. P. 3D-QSAR studies on a series of indoleamide derivatives as antiplasmodial drugs. Chin. J. Struct. Chem. 2018, 37, 1015–1024.
-
[21]
Castilho, M. S.; Postigo, M. P.; de Paula, C. B. V.; Montanari, C. A.; Oliva, G.; Andricopulo, A. D. Two- and three-dimensional quantitative structure-activity relationships for a series of purine nucleoside phosphorylase inhibitors. Bioorg. Med. Chem. 2006, 14, 516–527. doi: 10.1016/j.bmc.2005.08.055
-
[22]
Salum, L. D. B.; Polikarpov, I.; Andricopulo, A. D. Structural and chemical basis for enhanced affinity and potency for a large series of estrogen receptor ligands: 2D and 3D QSAR studies. J. Mol. Graphics Model. 2007, 26, 434–442. doi: 10.1016/j.jmgm.2007.02.001
-
[23]
Buolamwini, J. K.; Assefa, H. CoMFA and CoMSIA 3D QSAR and docking studies on conformationally-restrained cinnamoyl HIV-1 integrase inhibitors: exploration of a binding mode at the active site. J. Med. Chem. 2002, 45, 841–852. doi: 10.1021/jm010399h
-
[24]
Doytchinova, I. A.; Flower, D. R. Toward the quantitative prediction of T-cell epitopes: CoMFA and CoMSIA studies of peptides with affinity for the class I MHC molecule HLA-A*0201. J. Med. Chem. 2001, 44, 3572–3581. doi: 10.1021/jm010021j
-
[25]
Murthy, V. S.; Kulkarni, V. M. 3D-QSAR CoMFA and CoMSIA on protein tyrosine phosphatase 1B inhibitors. Bioorg. Med. Chem. 2002, 10, 2267–2282. doi: 10.1016/S0968-0896(02)00056-1
-
[26]
Awasthi, M.; Singh, S.; Pandey, V. P.; Dwivedi, U. N. CoMFA and CoMSIA-based designing of resveratrol derivatives as amyloid-beta aggregation inhibitors against Alzheimer's disease. Med. Chem. Res. 2018, 27, 1167–1185. doi: 10.1007/s00044-018-2138-4
-
[27]
Benigni, R.; Bossa, C. Predictivity of QSAR. J. Chem. Inf. Model. 2008, 48, 971–980. doi: 10.1021/ci8000088
-
[28]
Golbraikh, A.; Tropsha, A. Beware of q(2)! J. Mol. Graphics Modell. 2002, 20, 269–276. doi: 10.1016/S1093-3263(01)00123-1
-
[29]
Eriksson, L.; Jaworska, J.; Worth, A. P.; Cronin, M. T. D.; McDowell, R. M.; Gramatica, P. Methods for reliability and uncertainty assessment and for applicability evaluations of classification- and regression-based QSARs. Environ. Health Perspect. 2003, 111, 1361–1375. doi: 10.1289/ehp.5758
-
[1]
-
Figure 3 Scatterplot of experimental versus predicted pIC50 by comparative molecular field analysis (CoMFA) (a) and comparative molecular similarity indices analysis (CoMSIA) (b)
Table 1. Structures and Bioactivity Data of the Compounds in the Dataset
Sr.no Compound numbers X Ar Experimental
pIC50Predicted pIC50 CoMFA Residue CoMSIA Residue 1 1a - H 5.347 5.299 –0.048 5.339 –0.008 2** 1b - 3, 4-Me 5.745 5.732 –0.013 5.817 0.072 3 1c - 2-Me 5.432 5.442 0.010 5.404 –0.028 4 1d - 2-Br 5.483 5.521 0.038 5.549 0.066 5 1e - 2-Cl 5.481 5.497 0.016 5.393 –0.088 6 1f - 3, 4-Cl 5.690 5.695 0.005 5.657 –0.033 7 1g - 4-F 4.996 4.992 –0.004 5.013 0.017 8 2a - 4-Me 4.361 4.356 –0.005 4.447 0.086 9 2b - 2-Me 5.007 5.013 0.006 5.043 0.036 10 2c - 2-Br 5.678 5.605 –0.073 5.584 –0.094 11 2d - 2, 3-Cl 5.298 5.360 0.062 5.398 0.100 12* 2e - 3, 4-Cl 3.989 4.700 0.711 4.576 0.587 13* 2f - 4-Cl 4.532 4.676 0, 144 4.591 0.059 14 2g - 3-Cl 4.790 4.722 –0.068 4.666 –0.124 15 2h - 4-F 4.790 4.827 0.037 4.776 –0.014 16 2i - 3-F 4.648 4.684 0.036 4.662 0.014 17* 3a H 3-F 4.318 4.758 0.440 4.716 0.398 18 3b H 2-Cl 4.469 4.449 –0.020 4.459 –0.010 19* 3c H 2, 3-Cl 4.694 4.730 0.036 4.694 0.000 20 3d H 3, 4-Cl 4.777 4.806 0.029 4.754 –0.023 21* 3e H 2-Br 4.508 4.635 0.127 4.601 0.093 22 3f OMe 2-Me 4.618 4.625 0.007 4.688 0.070 23 3g OMe 2-Cl 4.812 4.805 –0.007 4.758 –0.054 24 3h OMe 2, 3-Cl 4.472 4.501 0.029 4.553 0.081 25 3i OMe 3, 4-Cl 4.593 4.556 –0.037 4.528 –0.065 * Represents molecules in the test set;
**Represents the most active inhibitor;
CoMFA, comparative molecular field analysis;
CoMSIA, comparative molecular similarity indices analysis 下载: 导出CSV
Table 2. Summary of Partial Least-squares (PLS) Results
Parameters PLS results CoMFA CoMSIA Q2 (cross-validated) 0.597 0.721 rpred2 (test) 0.728 0.805 PRESS 0.737 0.528 SD 2.708 2.708 Standard error of estimate 0.043 0.076 Optimum number of components 6 5 rncv2 (non-cross-validated) 0.994 0.979 Test value 346.726 131.107 Steric field contribution 0.609 0.148 Electrostatic field contribution 0.391 0.261 Hydrophobic field contribution - 0.569 Hydrogen bond donor field contribution - 0.021 Hydrogen bond acceptor field contribution - 0
下载: 导出CSV
Table 3. Predictive Activity of the Designed Small Molecules Based on CoMFA and CoMSIA Models
Compound_ ID Compound_ structure CoMFA CoMSIA N1 5.962 5.542 N2 5.743 5.841 N3 5.801 5.890 N4 5.760 6.064
下载: 导出CSV
-


 扫一扫看文章
计量
- PDF下载量: 3
- 文章访问数: 869
- HTML全文浏览量: 2
 下载:
下载: