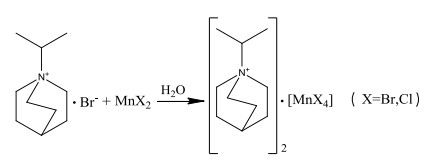
Scheme1.
Syntheses of 1 and 2
Two Low-temperature Phase Transition Compounds Based on Quinuclidine Derivatives with Fluorescence
Jun-Yi LI , Xiang CHEN , Liang TONG , Si-Yu DENG , Li-Zhuang CHEN

In the past few decades, solid-state to solid-state phase transition materials have attracted global attention due to their potential applications in data communications, signal processing, environmental monitoring, etc[1-12]. At the same time, molecular switchable dielectrics act as attractive functional electronic materials with a sudden change in dielectric constant between a high and a low dielectric states[13-21]. In order to explore new physical properties and study structural properties, it is necessary to prepare new phase transition materials. In particular, 1-azadiracyclic [2.2.2] octane (quinuclidine) with higher symmetry can be redirected by molecular rotation like a molecular motor, so the quinuclidine series of coordination polymers caused a wide range of attention[22-34]. In 2017, Xiong et al. reported a new molecular ferroelectric compound [C7H14NO4I] through self-assembly of periodate and quinuclidine with phase-transition temperature TC = 322 K[35]. It crystallizes in the orthorhombic space group Pmn21 at room temperature ferroelectric phase and the cubic space group Pm3m at high temperature paraelectric phase. In this study, 1-isopropyl-1-azabicyclo [2.2.2] octane, as the derivative of quinuclidine, was combined with metal halides, forming two inorganic-organic hybrid compounds [iPrQ]2MnBr4 (1) and [iPrQ]2MnCl4 (2). The two compounds were synthesized and characterized. Differential scanning calorimetry, single-crystal X-ray diffraction data and dielectric constant measurements showed that the compounds underwent a reversible phase transition from space group C2/c to Cc. Fluorescence test showed that the compounds have strong fluorescence. These findings may illustrate that these two compounds have potential applications in photoactive materials and they are the potential switchable dielectric materials which lead to the phase transition.
The starting materials and reagents used throughout the experiments were of analytical grade from commercial sources and were used without any further purification. Infrared (IR) spectra were recorded on a SHIMADZU IR prestige-21 FTIR-8400S spectrometer in the range of 4000~500 cm-1 with samples in the form of potassium bromide pellets. Elemental analyses were taken on a Perkin-Elmer 240C elemental analyser. Powder X-ray diffraction (PXRD) measurements were made with a Rigaku SA-HFM3 diffraction system from 2θ = 5° to 2θ = 50° at 6 °/min with an increment of 0.02º (Figs. S1~S2). Thermo-gravimetric analyses (TGA) were conducted on a TGA Q500 V20.13 Build 39 thermogravimeter at the heating rate of 10 K/min in a N2 atmosphere (Figs. S3~S4). Fluorescence properties of compounds were investigated using a Spectrofluorometer FS5 fluorescence tester.
Firstly, [iPrQ]Br (0.308 g, 2 mmol) and MnBr2 (0.21 g, 1 mmol) were placed in two beakers. After slowly adding distilled water and stirring to dissolve, the volume of distilled water is 10 mL, and then the two beaker solutions are mixed with each other. After stirring, the mixture was allowed to stand at room temperature for 7 days to obtain compound 1 (Scheme 1). IR data (KBr pellet, ν (cm-1)): 3415(m), 2957(s), 2879(m), 1612(w), 1464(s), 1393(m), 1134(m), 843(m) (Fig. S5). Anal. Calcd. (%) for C20H40N2Br4Mn: C, 27.01; H, 5.18; N, 6.25. Found (%): C, 26.46; H, 4.79; N, 6.01.
The synthesis method of 2 is the same as that of 1. The [iPrQ]Br (0.308 g, 2 mmol) and MnCl2 (0.198 g, 1 mmol) were placed in two beakers with the molar ratio of 2:1 firstly. After slowly adding distilled water and stirring to dissolve, the volume of distilled water is 10 mL, and then the two beaker solutions are mixed with each other. After stirring, the mixture was allowed to stand at room temperature for 7 days to obtain compound 2 (Scheme 1). IR data (KBr pellet, ν (cm-1)): 3418(m), 2960(s), 2875(m), 1625(w), 1315(w), 1135(m), 844(m), 565(vw) (Fig. S6). Anal. Calcd. (%) for C20H40N2Cl4Mn: C, 26.43; H, 4.62; N, 6.57. Found (%): C, 25.39; H, 4.72; N, 6.46.
Crystallographic data of two compounds of appropriate size were collected at different temperature on a Bruker SMART APEX-Ⅱ CCD diffractometer equipped with MoKα radiation (λ = 0.71073 Å). Absorption correction was applied by using SADABS. The structures were resolved by direct methods and refined with full-matrix least-squares method using the SHELXTL-97 software package[36, 37]. The distances and angles between some atoms are calculated using DIAMOND and other calculations were performed using SHELXLTL. All non-hydrogen atoms were refined with anisotropic thermal parameters. All hydrogen atoms attached to C, N and O atoms were added theoretically and refined with a riding model and fixed isotropic thermal parameters. The crystallographic data and details of collection and refinement at different temperature are given in Table 1.
 DownLoad:
CSV
DownLoad:
CSV
| [iPrQ]2MnCl4 (1) | [iPrQ]2MnCl4 (2) | ||||
| T (K) | 296 | 200 | 296 | 200 | |
| Empirical formula | C20H40N2Br4Mn | C20H40N2Br4Mn | C20H40N2Cl4Mn | C20H40N2Cl4Mn | |
| Formula weight | 683.12 | 683.12 | 505.28 | 505.28 | |
| Crystal system | Monoclinic | Monoclinic | Monoclinic | Monoclinic | |
| Space group | C2/c | Cc | C2/c | Cc | |
| a (Å) | 13.078(5) | 12.872(4) | 13.087(10) | 12.908(15) | |
| b (Å) | 12.706(5) | 12.696(4) | 13.028(10) | 12.898(15) | |
| c (Å) | 16.344(6) | 16.341(5) | 15.367(11) | 15.590(18) | |
| α (o) | 90 | 90 | 90 | 90 | |
| β (o) | 95.383(4) | 96.295(3) | 96.924(8) | 97.250(14) | |
| γ (o) | 90 | 90 | 90 | 90 | |
| V (Å3) | 2703.7(17) | 2654.6(15) | 2601(3) | 2575(5) | |
| Z | 4 | 4 | 4 | 4 | |
| Dc (g/m–3) | 1.678 | 1.709 | 1.290 | 1.303 | |
| μ (mm–1) | 6.408 | 6.527 | 0.927 | 0.936 | |
| F(000) | 1356 | 1356 | 1068 | 1068 | |
| θ range (º) | 3.129 to 24.498 | 3.184 to 25.999 | 2.486 to 24.999 | 2.241 to 24.724 | |
| Collected reflections | 1340 | 5195 | 2281 | 4365 | |
| Unique reflections | 2250 | 3720 | 1296 | 3431 | |
| R, wR (I > 2σ(I)) | 0.0666, 0.1665 | 0.0495, 0.1119 | 0.1242, 0.3235 | 0.0947, 0.2374 | |
| R, wR (all data) | 0.1174, 0.1915 | 0.0802, 0.1239 | 0.2128, 0.3708 | 0.1243, 0.2679 | |
| GOF | 1.022 | 0.976 | 1.265 | 1.114 | |
The compound dielectric permittivity (ε = ε΄ – iε΄΄) was measured on a Tonghui TH2828A in the frequency range from 500 Hz to 1 MHz from –40 to 30 ℃ at the AC voltage of 1 V. A pellet sample was prepared at 10 MPa and the pressed powder pellet deposited with silver-conducting glue was used for the dielectric studies.
DSC analyses of crystals 1 (6.5 mg) and 2 (7.2 mg) were recorded using a Perkin Elmer Diamond DSC instrument in the range of –100 to 25 ℃ and –100 to 75 ℃ with a heating rate of 10 K·min−1 on cooling/heating under nitrogen at atmospheric pressure in aluminum crucibles, respectively.
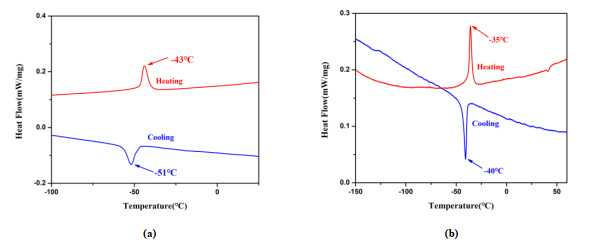
It is well-known that DSC measurement is one of the useful thermodynamic methods to detect the dependence of reversible phase transition on temperature. When a compound undergoes structural phase transition accompanied by thermal entropy change, heat anomalies can be observed during heating and cooling.
The DSC result of compound 1 exhibited a clear endothermic peak at –43 ℃ upon heating and an exothermic peak on cooling at –51 ℃ (Fig. 1a). Through the heating curve of DSC, the enthalpy change of ΔH = 1.94 J·g−1, and the corresponding change in entropy, ΔS, is 5.76 J (mol·K)−1. Through the cooling curve of DSC, ΔH = 2.22 J·g−1, and the corresponding ΔS = 6.83 J (mol·K)−1. The pair of endothermic and exothermic peaks clearly revealed that a reversible phase transition occurred around –43 ℃ with an 8 ℃ thermal hysteresis. Both the peak shape of the thermal anomalies and the narrow thermal hysteresis loop indicated the character of the phase transition for 1. DSC of compound 2 showed a main endothermic peak at –35 ℃ upon heating and a main exothermic peak on cooling at –40 ℃ (Fig. 1b). Through the heating curve of DSC, ΔH is 0.036 J·g−1, and ΔS is 0.076 J (mol·K)−1. Through the cooling curve of DSC, ΔH = 0.030 J·g−1 and ΔS = 0.065 J (mol·K)−1. The shapes of these two main peaks and the thermal hysteresis of 5 ℃ revealed the character of the reversible phase transitions.
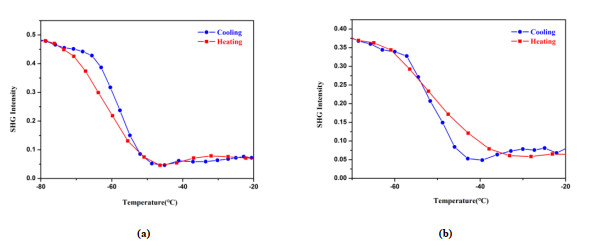
The symmetry change accompanying the phase transition in compounds 1 and 2 was further investigated by the measurement of the second harmonic generation (SHG) response as a function of temperature, which is a reliable method to detect the change of inversion symmetry. As shown in Fig. 2a, 1 is SHG active with detectable intensities below –47 ℃, which indicates a non-centrosymmetric phase, consistent with the ferroelectric Cc point group having symmetry elements of E and Cc. No SHG signal is observable above –47 ℃ due to the appearance of inversion symmetry in the centrosymmetric C2/c space group. Thus, the SHG results combined with the structure analyses clearly reveal that the phase transition around –47 ℃ is from a non-centrosymmetric low-temperature phase to a centrosymmetric room-temperature one. In addition, the continuous variation of SHG intensity in the vicinity of –47 ℃ matches well with the DSC results. Similar to that observation in the DSC curves of 1, a small thermal hysteresis appears between the heating and cooling runs related to the temperature changing rate of 10 K/min in the testing process. Compound 2 has similar SHG intensity to 1 except that the phase transition point is around –37 ℃, as shown in Fig. 2b.
The phase transition of 1 was further confirmed by determining the crystal structures at 296 and 200 K, respectively. Both the asymmetric units of LTP and RTP are composed of two separated [iPrQ]+ cations and a four-coordinated MnBr42- anion. In RTP (296 K), the crystals are in monoclinic system with space group C2/c and C2h point group. The cell parameters of 1 at 296 K are as follows: a = 13.078(5), b = 12.706(5), c = 16.344(6) Å, V = 2703.7(17) Å3 and Z = 4. When cooled to 200 K, the crystals are in non-centrosymmetric space group Cc and the point group C3 with a = 12.872(4), b = 12.696(4), c = 16.341(5) Å, V = 2654.6(15) Å3 and Z = 4.
In the room-temperature phase (RTP) (296 K), the coordination environment of 1 includes two [iPrQ]+ cations and a tetrahedral [MnBr4]2– anion (Fig. 3a). The Mn(Ⅱ) ion is in a slightly distorted tetrahedral environment with four Br atoms. The bond distances of Mn–Br (symmetry code: #1: 0.5 + x, 0.5 − y, 0.5 + z) are 2.4992, 2.4729, 2.4992 and 2.4729 Å, respectively, and the bond angles of Br–Mn–Br are from 104.139° to 113.346°, which are comparable to the reported values[38, 39]. In the RTP unit cell, one non-hydrogen atom (Mn) was located in c slide plane with an occupancy factor of 0.5 (Fig. 4a), while others apart from the above slide plane can be produced by (0.5 + x, 0.5 − y, 0.5 + z) and (1 − x, y, 1.5 − z) symmetry transformation.
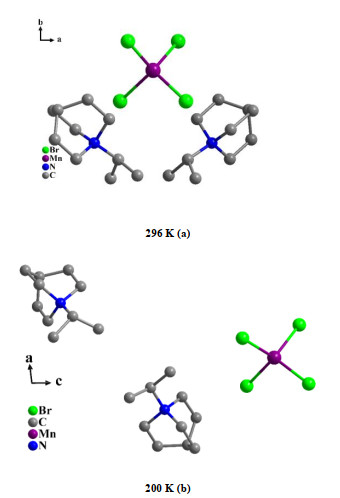
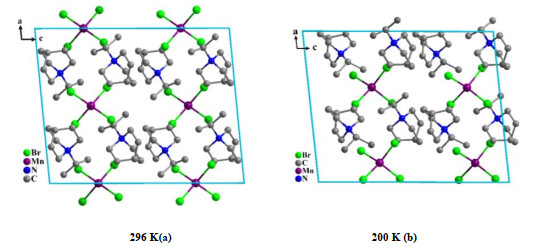
In the low-temperature phase (LTP) (200 K), the coordination environment of 1 includes two [iPrQ]+ cations and a tetrahedral [MnBr4]2- anion just like that at room temperature. The Mn(Ⅱ) ion also adopts a distorted tetrahedral geometry (Fig. 3b). The bond distances of Mn–Br are 2.4865, 2.4852, 2.5109 and 2.4971 Å, respectively, and the bond angles of Br–Mn–Br are from 104.769° to 114.391°, which are slightly different from those in RTP. In the LTP unit cell, non-hydrogen atoms apparently deviated from the crystallographic mirror plane (Fig. 4b). Meanwhile, the conformations of the rings of the quinuclidine ligand showed some differences between the two phases. The torsion angle of N–C–C–C in quinuclidine rings is from 0.369° to 1.977° at 296 K. Moreover, N–C–C–C exhibited large twisting conformations with the torsion angles from 1.096° to 8.403° at 200 K, suggesting that the rings were seriously distorted compared with those in RTP. This indicates that the quinuclidine ring of the [iPrQ]+ cation has changed when changing the temperature. With the disappearance of partial symmetry codes, the Mn–Br distances and bond angles of Br–Mn–Br are slightly different from RTP (Table S1).
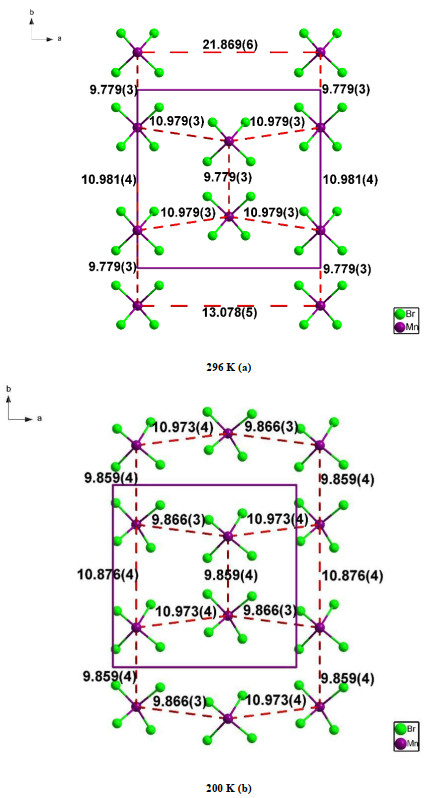
The distances of adjacent Mn metals along the c axis have been studied in order to further demonstrate the differences between the room temperature and low temperature phases. At room temperature, ten Mn metals can be seen along the c-axis. The bonds of Mn⋯Mn were connected to study the differences between different temperature. As shown in
Fig. 5a, there were some kinds of distances of adjacent Mn, which were between 9.7793 and 21.8696 Å. When cooled, the position of the left Mn metals was changed along the direction of the arrow. Below TC (Fig. 5b), the distances of adjacent Mn⋯Mn changed for four kinds of 9.8594, 9.8663, 10.8764 and 10.9734 Å. The positions of the manganese atoms changed at different temperature, which further proved the occurrence of phase transition.
Variable-temperature crystal structures at 296 and 200 K showed that compound 2 underwent a phase transition. In RTP (296 K), the crystals are in monoclinic space group with space group C2/c and point group C2h, as the same as 1. The cell parameters of 2 measured at 296 K are as follows: a = 13.087(10), b = 13.028(10), c = 15.367(11) Å, V = 2601(3) Å3 and Z = 4. When cooled to 200 K, the crystals are in space group Cc and the point group C3, similar to 1, with a = 12.908(15), b = 12.898(15), c = 15.590(18) Å, V = 2575(5) Å3 and Z = 4.
In the room-temperature phase (RTP) (296 K), the coordination environment of 2 includes two [iPrQ]+ cations and a tetrahedral [MnCl4]2– anion (Fig. 6a). The Mn(Ⅱ) ion is in a slightly distorted tetrahedral environment with four Cl atoms. The bond distances of Mn–Cl (symmetry code: #1: 2 − x, y, 1.5 − z) are 2.3807, 2.3926, 2.3926 and 2.3807 Å, respectively, and the bond angles of Cl–Mn–Cl are from 104.065° to 113.196°, which are comparable to the reported values[40, 41]. In the RTP unit cell, one non-hydrogen atom (Mn) was located on the c slide plane with an occupancy factor of 0.5 (Fig. 7a), while others apart from the above mirror plane can be produced by (2 − x, y, 1.5 − z) symmetry transformation.
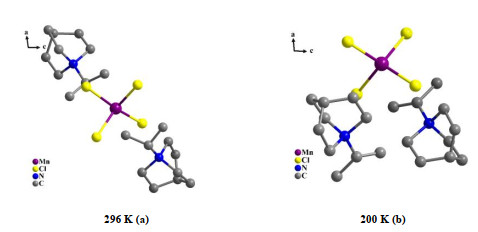
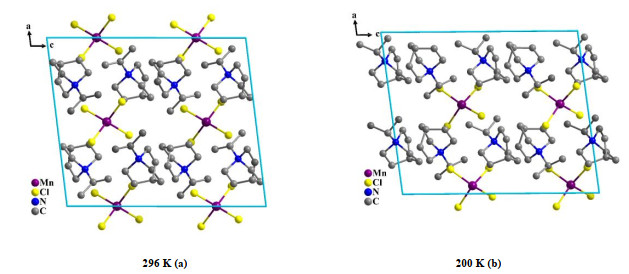
In the low-temperature phase (LTP) (200 K), the coordination environment of 1 includes two [(CH3)2CHC7H13N]+ cations and a tetrahedral [MnCl4]2- anion just like that at room temperature. The Mn(Ⅱ) ion also adopts a distorted tetrahedral geometry (Fig. 6b). The bond distances of Mn(1)–Cl(2), Mn(1)–Cl(3), Mn(1)–Cl(4) and Mn(1)–Cl(5) are 2.4205, 2.4092, 2.3990 and 2.4123 Å, respectively, and the bond angles of Cl–Mn–Cl are from 105.268° to 113.334°, which are slightly different from those in RTP. In the LTP unit cell, non-hydrogen atoms apparently deviated from the crystallographic slide plane (Fig. 7b). Meanwhile, the conformations of the rings of the quinuclidine ligand showed some differences between the two phases. The torsion angle of N–C–C–C in quinuclidine rings is from 2.612° to 6.017° at 296 K. Moreover, N–C–C–C exhibited large twisting conformations with the torsion angles from 5.135° to 17.689° at 200 K, suggesting that the rings were seriously distorted compared with those in RTP. This indicates that the quinuclidine ring of the [iPrQ]+ cation has changed with the temperature change. With the disappearance of partial symmetry codes, the Mn–Cl distances and bond angles of Cl–Mn–Cl are slightly different from RTP (Table S2).
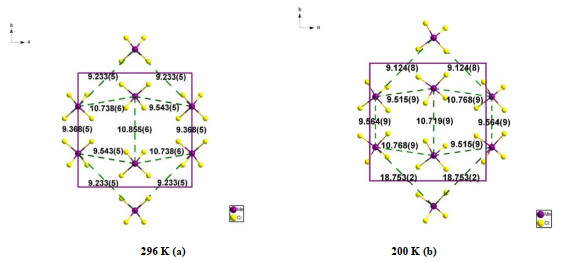
The distances of adjacent Mn metals along c axis have been studied in order to further demonstrate the differences between the room temperature and low temperature phases. At room temperature, eight Mn metals can be seen along the c-axis. The bonds of Mn⋯Mn were connected to study the differences between different temperatures. As shown in Fig. 8a, there were some kinds of distances of adjacent Mn, which were between 9.2335 and 10.8556 Å. When cooled, the position of the left Mn metals was changed. Below TC (Fig. 8b), the distances of adjacent Mn⋯Mn changed for six kinds, which were from 9.1248 to 18.7532 Å. The positions of the manganese atoms changed at different temperature, which further proved the occurrence of phase transition.
The dielectric constant (both real part ε΄ and dielectric loss) undergoes abrupt changes in the vicinity of phase transition, while the magnitude of the variations was related to the characteristics of such transitions[42-49].
The dielectric permittivity of 1 was measured in the frequency range between 500 Hz and 1 MHz in cooling and heating modes. As illustrated in Fig. 9a, the real part (ε΄) of the dielectric constant distinctly experienced an obvious dielectric transition in the temperature interval of –60~–35 ℃. In detail, it remained almost unchanged at –60 ℃, but progressively and clearly augmented up to 2501 at 500 Hz between –40 and –30 ℃, especially showing strong frequency dependence and a prominent change up to approximately –35.9 ℃. Notably, the real part displayed a fold point at –35.9 ℃, which was an extremely effective indicator of structural phase transition, corresponding well to the phase transition temperature determined by DSC characterizations.
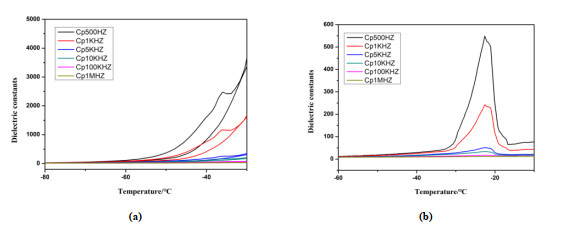
The dielectric permittivity of 2 was measured with a same parameter of compound 1. As presented in Fig. 9b, the real part (ε΄) of dielectric constant is subjected to a wide dielectric transition in the temperature interval of –30~–16 ℃. In detail, it remained almost unchanged at –30 ℃, but then progressively and clearly rose up to 548 at 500 Hz, between –30 and –16 ℃, especially showing strong frequency dependence and a prominent change up to approximately –23 ℃. The dielectric diagram on the heating process was placed in Fig. S7. Such a dielectric anomaly indicates a phase transition.
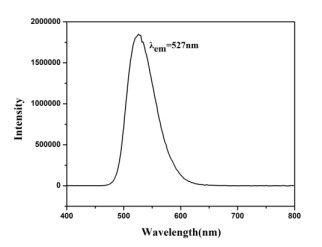
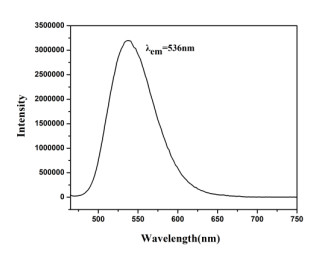
The synthesized organic compound [iPrQ]Br does not show obvious photoluminescence properties, but it can produce fluorescence when the ligand binds with metal ions, which may be due to ligand-metal charge transfer (LMCT) or metal-ligand charge transfer (MLCT)[50, 51]. The fluorescence property of compound 1 was investigated using a Spectrofluorometer FS5 fluorescence tester. The fluorescence emission spectrum of this compound is shown in Fig. 10. As demonstrated in the figure, the excitation wavelength is 364 nm and the emission wavelength is 527 nm, which displays the brilliant green light. The fluorescent property of compound 2 was the same as that of 1. The fluorescence emission spectrum of this compound is shown in Fig. 11. It is found from Fig. 11 that the excitation wavelength is 453 nm and the emission wavelength is 536 nm. These suggest that both compounds 1 and 2 may be good visible luminescent materials.
In summary, two low temperature phase transition compounds [(CH3)2CH-C7H13N]2MnBr4 (1) and [(CH3)2CH-C7H13N]2MnCl4 (2) were synthesized. Variable-temperature structural analysis, DSC and dielectric measurements revealed that compound 1 underwent reversible low-temperature phase transition at around 228 K and compound 2 underwent reversible low-temperature phase transition at around 236 K. Single-crystal X-ray diffraction demonstrated that compounds 1 and 2 crystallize in orthorhombic space group C2/c at RTP and in the monoclinic space group Cc at LTP. The dynamics of the quinuclidine ring of the [(CH3)2CHC7H13N]+ cation is inseparable in the mechanism of the phase transition. The change of the dielectric permittivity and the second harmonic generation (SHG) response give compounds 1 and 2 greater application potentials as low temperature phase transition materials.
There are no conflicts to declare.
Ye, H. Y.; Cai, H. L.; Ge, J. Z.; Xiong, R. G. Isosymmetric temperature-triggered structural phase transition of dabcodiium chlorochromate chloride. Inorg. Chem. Commun. 2012, 17, 159–162. doi: 10.1016/j.inoche.2011.12.040
Asghar, M. A.; Ji, C. M.; Zhou, Y. L.; Sun, Z. H.; Khan, T.; Zhang, S. Q.; Zhao, S. G.; Luo, J. H. Order-disorder phase transition coupled with torsion in tri-n-butylammonium trichloroacetate (TBAT). J. Mater. Chem. C 2015, 3, 6053–6057. doi: 10.1039/C5TC00989H
Kong, L. H.; Fu, D. W.; Ye, Q.; Ye, H. Y.; Zhang, Y.; Xiong, R. G. Iso-structural phase transition in tetramethylammonium nickel(Ⅱ) nitrite [(CH3)4N][Ni(NO2)3]. Chin. Chem. Lett. 2014, 25, 844–848. doi: 10.1016/j.cclet.2014.05.028
Wang, X. L.; Zhou, L.; Ye, Q.; Geng, F. J.; Ye, H. Y.; Fu, D. W.; Zhang, Y. A spiro-type ammonium based switchable dielectric material with two sequential reversible phase transitions above room temperature. RSC. Adv. 2016, 6, 74117–74123. doi: 10.1039/C6RA14157A
Wu, D. H.; Jin, L. Temperature-induced isosymmetric reversible structural phase transition in triethylbenzylammonium perchlorate. Inorg. Chem. Commun. 2013, 29, 151–156. doi: 10.1016/j.inoche.2012.12.032
Shi, P. P.; Ye, Q.; Li, Q.; Wang, H. T.; Fu, D. W.; Zhang, Y.; Xiong, R. G. Novel phase-transition materials coupled with switchable dielectric, magnetic, and optical properties: [(CH3)4P][FeCl4] and [(CH3)4P][FeBr4]. Chem. Mater. 2014, 26, 6042–6049. doi: 10.1021/cm503003f
Chen, H. P.; Shi, P. P.; Wang, Z. X.; Gao, J. X.; Zhang, W. Y.; Chen, C.; Tang, Y. Y.; Fu, D. W. Tunable dielectric transitions in layered organic-inorganic hybrid perovskite-type compounds: [NH3(CH2)2Cl]2[CdCl4−4xBr4x] (x = 0, 1/4, 1). Dalton Trans. 2018, 47, 7005–7012. doi: 10.1039/C8DT00353J
Liu, Y.; Zhou, H. T.; Chen, S. P.; Tan, Y. H.; Wang, C. F.; Yang, C. S.; Wen, H. R.; Tang, Y. Z. Reversible phase transition and switchable dielectric behaviors triggered by rotation and order-disorder motions of crowns. Dalton Trans. 2018, 47, 3851–3856. doi: 10.1039/C8DT00003D
Salinga, M.; Wuttig, M. Phase-change memories on a Diet. Science 2011, 332, 543–544. doi: 10.1126/science.1204093
Mao, C. Y.; Liao, W. Q.; Wang, Z. X.; Zafar, Z.; Li, P. F.; Lv, X. H.; Fu, D. W.; Xiong, R. G. Temperature-triggered dielectric-optical duple switch based on an organic inorganic hybrid phase transition crystal: [C5N2H16]2SbBr5. Inorg. Chem. 2016, 55, 7661–7666. doi: 10.1021/acs.inorgchem.6b01107
Hua, X. N.; Liao, W. Q.; Tang, Y. Y.; Li, P. F.; Shi, P. P.; Zhao, D. W. A room-temperature hybrid lead iodide perovskite ferroelectric. J. Am. Chem. Soc. 2018, 140, 12296−12302. doi: 10.1021/jacs.8b08286
Chen, X.; Zhou, H.; Chen, Y. Y.; Yuan, A. H. Ligand-concentration-dependent self-organization of Hoffman- and PtS-type frameworks from one-pot crystallization. CrystEngComm. 2011, 13, 5666–5669. doi: 10.1039/c1ce05699a
Tang, Y. Z.; Wang, B.; Zhou, H. T.; Chen, S. P.; Tan, Y. H.; Wang, C. F.; Yang, C. S.; Wen, H. R. Reversible phase transition with ultralarge dielectric relaxation behaviors in succinimide lithium(I) hybrids. Inorg. Chem. 2018, 57, 1196−1202. doi: 10.1021/acs.inorgchem.7b02625
Zhang, Y. W.; Shi, P. P.; Zhang, W. Y.; Ye, Q.; Fu, D. W. Reversible thermal dielectric switch triggered by blooming-flower structural phase transition in ionic crystal without metal. Inorg. Chem. 2018, 57, 10153−10159. doi: 10.1021/acs.inorgchem.8b01306
Jeon, N. J.; Noh, J. H.; Kim, Y. C.; Yang, W. S.; Ryu, S.; Seok, S. I. Solvent engineering for high-performance inorganic-organic hybrid perovskite solar cells. Nat. Mater. 2014, 13, 897–903. doi: 10.1038/nmat4014
Cao, D. H.; Stoumpos, C. C.; Farha, O. K.; Hupp, J. T.; Kanatzidis, M. G. 2D homologous perovskites as light-absorbing materials for solar cell applications. J. Am. Chem. Soc. 2015, 137, 7843–7850. doi: 10.1021/jacs.5b03796
Shi, C.; Zhang, X.; Cai, Y. Y.; Yao, F.; Zhang, W. A chemically triggered and thermally switched dielectric constant transition in a metal cyanide based crystal. Angew. Chem. Int. Ed. 2015, 54, 6206–6210. doi: 10.1002/anie.201501344
Abhijit, S.; Diptikanta, S.; Tayur, N. G. R.; Sundaresan, A. Unprecedented 30 K hysteresis across switchable dielectric and magnetic properties in a bright luminescent organic-inorganic halide (CH6N3)2MnCl4. J. Mater. Chem. C 2019, 7, 4838–4845. doi: 10.1039/C9TC00663J
Sui, Y.; Chen, W. T.; Ouyang, S. X.; Wang, W. Q.; Zhang, G. X.; Liu, D. S. A semiconducting organic-inorganic hybrid metal halide with switchable dielectric and high phase transition temperature. J. Phys. Chem. C 2019, 123, 9364–9370.
Sui, Y.; Zhang, G. X.; Wang, W. Q.; Hu, F.; Liu, C. L.; Luo, D.; Liu, D. S. A semiconducting organic-inorganic hybrid metal halide [(C6H15ClNO)2CdBr4] with switchable dielectric and large phase transition thermal hysteresis. ChemistrySelect. 2019, 4, 3921–3925. doi: 10.1002/slct.201900598
Fang, T.; Jie, Y.; Huang, Y.; Ye, Y. H.; Chen, W. B.; Li, B. Q.; Zou, C.; Xu, D. L.; Qian, K. Z. Above room temperature organic dielectric switchable material: diprotonated 1, 4-diazabicyclo[2.2. 2]octane shifts between two pyruvic acids. Anorg. Allg. Chem. 2019, 645, 3–7. doi: 10.1002/zaac.201800362
Linda, B.; Ana, M.; Lucija, K.; Barbara, S.; Renata, O.; Butevic, P. V.; Ivica, A.; Ines, P.; Matilda, S. Discovery of novel quaternary ammonium compounds based on quinuclidine-3-ol as new potential antimicrobial candidates. Eur. J. Med. Chem. 2019, 163, 626–635. doi: 10.1016/j.ejmech.2018.12.023
Chen, L. Z.; Ji, Q.; Wang, X. G.; Pan, Q. J.; Cao, X. X. Two novel metal-organic coordination polymers based on ligand 1, 4-diazabicyclo[2.2. 2]octane N, N΄-dioxide with phase transition, and ferroelectric and dielectric properties. CrystEngComm. 2017, 19, 5907–5914. doi: 10.1039/C7CE00964J
Chen, L. Z.; Huang, D. D.; Pan, Q. J.; Ge, J. Z.; Wang, F. M. Temperature-induced reversible structural phase transition of 1-(chloromethyl)-1, 4-diazoniabicyclo[2.2. 2]octane bis(perchlorate). CrystEngComm. 2014, 16, 2944–2949. doi: 10.1039/c3ce42190b
Zhang, Y.; Zhang, W.; Li, S. H.; Ye, Q.; Cai, H. L.; Deng, F.; Xiong, R. G.; Huang, S. D. Ferroelectricity induced by ordering of twisting motion in a molecular rotor. J. Am. Chem. Soc. 2012, 134, 11044–11049. doi: 10.1021/ja3047427
Fan, G. M.; Gao, J. X.; Shi, C.; Yu, H.; Ye, L.; Jiang, J. Y.; Shuai, C. J.; Zhang, Y.; Ye, H. Y. [C7H14NO][ClO4]: order-disorder structural change induced sudden switchable dielectric behaviour at room temperature. CrystEngComm. 2018, 20, 7058–7061. doi: 10.1039/C8CE01461B
Szafran, Z. D.; Katrusiak, A.; Szafran, M.; Barczynski, P. Hydrogen bonding and molecular association in 2-(quinuclidinium)-butyric acid bromide hydrate studied by X-ray diffraction, DFT calculations, FTIR and NMR spectroscopy, and potentiometric titration. J. Mol. Struct. 2010, 975, 357–366. doi: 10.1016/j.molstruc.2010.05.004
Chen, L. Z.; Huang, D. D.; Ge, J. Z.; Pan, Q. J. Temperature-induced reversible structural phase transition of N-chloromethyl-1, 4-diazabicyclo[2.2. 2] octonium trichloroaquo-manganese(Ⅱ). J. Mol. Struct. 2014, 1072, 307–312. doi: 10.1016/j.molstruc.2014.05.041
Chen, L. Z.; Huang, D. D.; Pan, Q. J.; Zhang, L. Temperature-induced isosymmetric reversible structural phase transition in [Cl2Cd(dabco-CH2Cl)]2·(μ-Cl)2. J. Mol. Struct. 2014, 1078, 68–73. doi: 10.1016/j.molstruc.2014.03.030
Burilova, E. A.; Pashirova, T. N.; Lukashenko, S. S.; Sapunova, A. S.; Voloshina, A. D.; Zhiltsova, E. P.; Campos, J. R.; Souto, E. B.; Zakharova, L. Y. Synthesis, biological evaluation and structure-activity relationships of self-assembled and solubilization properties of amphiphilic quaternary ammonium derivatives of quinuclidine. J. Mol. Liq. 2018, 272, 722–730. doi: 10.1016/j.molliq.2018.10.008
Chen, L. Z.; Liao, W. Q.; Ai, Y.; Li, J. Y.; Deng, S. Y.; Hou, Y. L.; Tang, Y. Y. Precise molecular design toward organic-inorganic zinc chloride ABX3 ferroelectrics. J. Am. Chem. Soc. 2020, 142, 6236–6243. doi: 10.1021/jacs.0c00315
Naumiec, G. R.; Cai, L. S.; Lu, S. Y.; Pike, V. W. Quinuclidine and dabco enhance the radiofluorination of 5-substituted 2-halopyridines. Eur. J. Org. Chem. 2017, 45, 6593–6603.
Zhang, H. Y.; Tang, Y. Y.; Shi, P. P.; Xiong, R. G. Toward the targeted design of molecular ferroelectrics: modifying molecular symmetries and homochirality. Acc. Chem. Res. 2019, 52, 1928–1938. doi: 10.1021/acs.accounts.8b00677
Chen, C. H.; Xu, G. C. Synthesis, characterization and disorder-order phase transition of inorganic-organic hybrid materials (H2dabco-CH2-Cl)[MⅡCl4] (M = Co, Zn). CrystEngComm. 2016, 18, 550–557. doi: 10.1039/C5CE02059J
You, Y. M.; Tang, Y. Y.; Li, P. F.; Zhang, H. Y.; Zhang, W. Y.; Zhang, Y.; Ye, H. Y.; Nakamura, T.; Xiong, R. G. Quinuclidinium salt ferroelectric thin-film with duodecuple-rotational polarization-directions. Nat. Commun. 2017, 8, 14934. doi: 10.1038/ncomms14934
Sheldrick, G. M. SHELXS-97, Program for Crystal Structure Refinement. University of Gottingen, Germany 1997.
Sheldrick, G. M. SHELXL-97, Program for Crystal Structure Solution. University of Gottingen, Germany 1997.
Chen, C.; Deng, S. Y.; Li, J. Y.; Li, L. H.; Ji, Q.; Chen, L. Z. Two novel high temperature phase transition compound based on ligand 1, 4-dimethyl-1, 4-diazabicyclo[2.2. 2]octane. J. Mol. Struct. 2019, 1183, 384–389. doi: 10.1016/j.molstruc.2019.01.085
Chen, L. Z.; Cao, X. X.; Pan, Q. J.; Ji, Q. Super deuterated isotope effect in phase transition materials based on 2, 6-dimethylaniline. Chem. Select. 2016, 1, 6499–6506.
Chen, L. Z.; Huang, D. D.; Pan, Q. J.; Ge, J. Z. Novel pure Pnma-P212121 ferroelastic phase transition of 1, 4-diisopropyl-1, 4-diazonia-bicyclo[2.2. 2] octane tetra-chlorobromo-M(Ⅱ) (M = Mn and Co). RSC. Adv. 2015, 5, 13488–13494. doi: 10.1039/C4RA12690D
Chen, L. Z.; Cao, X. X.; Huang, D. D.; Pan, Q. J. Temperature-induced reversible structural phase transition of 1, 4-dimethyl-1, 4-diazabicyclo[2.2. 2] octane bis(perchlorate). RSC. Adv. 2015, 5, 55914–55919. doi: 10.1039/C5RA07526B
Zhang, Y.; Awaga, K.; Yoshikawab, H.; Xiong, R. G. Ferroelastic phase transition and dielectric anomalies in 2, 4, 6-trimethylanilinium perchlorate. J. Mater. Chem. 2012, 22, 9841–9845. doi: 10.1039/c2jm30581j
Ji, Q.; Li, L. H.; Deng, S. Y.; Cao, X. X.; Chen, L. Z. High switchable dielectric phase transition originating from distortion in inorganic-organic hybrid materials (H2dabco-C2H5) [MⅡCl4] (M = Co, Zn). Dalton Trans. 2018, 47, 5630–5638. doi: 10.1039/C8DT00623G
Ye, H. Y.; Liao, W. Q.; Zhou, Q. H.; Zhang, Y.; Wang, J. L.; You, Y. M.; Wang, J. Y.; Chen, Z. N.; Li, P. F.; Fu, D. W.; Huang, S. D. P.; Xiong, R. G. Dielectric and ferroelectric sensing based on molecular recognition in Cu(1, 10-phenlothroline)2SeO4·(diol) systems. Nat. Commun. 2017, 8, 14551. doi: 10.1038/ncomms14551
Chen, L. Z.; Sun, J.; Ji, Q.; Pan, Q. J.; Huang, Y. Switchable dielectric materials based on 2-methylimidazole. Chin. J. Struct. Chem. 2017, 36, 329–337.
Li, Q.; Shi, P. P.; Ye, Q.; Wang, H. T.; Deng, D. H.; Ye, H. Y.; Fu, D. W.; Zhang, Y. A switchable molecular dielectric with two sequential reversible phase transitions: [(CH3)4P]4[Mn(SCN)6]. Inorg. Chem. 2015, 54, 10642–10647. doi: 10.1021/acs.inorgchem.5b01437
Chen, L. Z.; Ji, Q.; Dan, Y. Y. Synthesis, structure, and luminescent and dielectric properties of two novel 1D chains based on a t-shaped tripodal ligand 4-(4, 5-dicarboxy-1H-imidazol-2-yl)pyridine loxide. Chin. J. Struct. Chem. 2016, 35, 1728–1735.
Zhang, Y.; Awaga, K.; Yoshikawab, H.; Xiong, R. G. Ferroelastic phase transition and dielectric anomalies in 2, 4, 6-trimethylanilinium perchlorate. J. Mater. Chem. 2012, 22, 9841–9845. doi: 10.1039/c2jm30581j
Wang, M. J.; Chen, X. R.; Tong, Y. B.; Yuan, G. J.; Ren, X. M.; Liu, L. J. Phase transition, dielectrics, single-ion conductance, and thermochromic luminescence of an inorganic-organic hybrid of [triethylpropylammonium][PbI3]. Inorg. Chem. 2017, 56, 9525–9534. doi: 10.1021/acs.inorgchem.7b00881
Chen, L. Z.; Wang, F. M.; Shu, H. Construction of three metal-organic frameworks based on multifunctional T-shaped tripodal ligands (4, 5-dicarboxy-1H-imidazol-2-yl)pyridine-1-oxide. J. Coord. Chem. 2012, 65, 439–452. doi: 10.1080/00958972.2012.654786
Tang, Y. Z.; Xiong, J. B.; Gao, J. X.; Tan, Y. H.; Xu, Q.; Wen, H. R. Spontaneous resolution, asymmetric catalysis, and fluorescence properties of Δ- and Λ-[Cu(Tzmp)]n enantiomers from in situ [2 + 3] cycloaddition synthesis. Inorg. Chem. 2015, 54, 5462–5466. doi: 10.1021/acs.inorgchem.5b00478

Figure 3 Asymmetric unit of compound 1 (a) 296 K. Symmetry codes: #1: 0.5 + x, 0.5 − y, 0.5 + z; #2: 1 − x, y, 1.5 – z. (b) 200 K. All H atoms were omitted for clarify

Figure 4 Unit cell packing diagrams of 1 at (a) 296 K and (b) 200 K. All H atoms were omitted for clarify

Figure 5 Different distances of adjacent Mn metals along an axis between (a) 296 K and (b) 200 K

Figure 6 Asymmetric units of compound 2 viewed along b-axis (a) 296 K, symmetry code: #1: 2−x, y, 1.5−z; (b) 200 K. All H atoms were omitted for clarify

Figure 7 Unit cell packing diagrams of 2 at (a) 296 K and (b) 200 K. All H atoms were omitted for clarify

Figure 8 Different distances of adjacent Mn metals along an axis between (a) 296 K and (b) 200 K

Figure 9 (a) Temperature-dependent real parts of dielectric constants of 1 on cooling and heating recorded at different frequencies; (b) Temperature-dependent real parts of dielectric constants of 2 on the cooling progress recorded at different frequencies
Table 1. Crystallographic Data for 1 and 2 at Different Temperature
| [iPrQ]2MnCl4 (1) | [iPrQ]2MnCl4 (2) | ||||
| T (K) | 296 | 200 | 296 | 200 | |
| Empirical formula | C20H40N2Br4Mn | C20H40N2Br4Mn | C20H40N2Cl4Mn | C20H40N2Cl4Mn | |
| Formula weight | 683.12 | 683.12 | 505.28 | 505.28 | |
| Crystal system | Monoclinic | Monoclinic | Monoclinic | Monoclinic | |
| Space group | C2/c | Cc | C2/c | Cc | |
| a (Å) | 13.078(5) | 12.872(4) | 13.087(10) | 12.908(15) | |
| b (Å) | 12.706(5) | 12.696(4) | 13.028(10) | 12.898(15) | |
| c (Å) | 16.344(6) | 16.341(5) | 15.367(11) | 15.590(18) | |
| α (o) | 90 | 90 | 90 | 90 | |
| β (o) | 95.383(4) | 96.295(3) | 96.924(8) | 97.250(14) | |
| γ (o) | 90 | 90 | 90 | 90 | |
| V (Å3) | 2703.7(17) | 2654.6(15) | 2601(3) | 2575(5) | |
| Z | 4 | 4 | 4 | 4 | |
| Dc (g/m–3) | 1.678 | 1.709 | 1.290 | 1.303 | |
| μ (mm–1) | 6.408 | 6.527 | 0.927 | 0.936 | |
| F(000) | 1356 | 1356 | 1068 | 1068 | |
| θ range (º) | 3.129 to 24.498 | 3.184 to 25.999 | 2.486 to 24.999 | 2.241 to 24.724 | |
| Collected reflections | 1340 | 5195 | 2281 | 4365 | |
| Unique reflections | 2250 | 3720 | 1296 | 3431 | |
| R, wR (I > 2σ(I)) | 0.0666, 0.1665 | 0.0495, 0.1119 | 0.1242, 0.3235 | 0.0947, 0.2374 | |
| R, wR (all data) | 0.1174, 0.1915 | 0.0802, 0.1239 | 0.2128, 0.3708 | 0.1243, 0.2679 | |
| GOF | 1.022 | 0.976 | 1.265 | 1.114 | |
 下载: 导出CSV

 扫一扫看文章

扫一扫关注我们


 下载:
下载: