State Key Laboratory of Bioactive Substance and Function of Natural Medicines, Institute of Materia Medica, Chinese Academy of Medical Sciences & Peking Union Medical College, Beijing 100050, China
b.
School of Life Sciences and Biopharmaceutical Science, Shenyang Pharmaceutical University, Shenyang 110016, China
c.
Beijing Key Laboratory of Drug Delivery Technology and Novel Formulation, Institute of Materia Medica, Chinese Academy of Medical Sciences & Peking Union Medical College, Beijing 100050, China
* Corresponding authors. E-mail addresses: fayongcui@163.com (Y. Cui), zhaohuiwang@imm.ac.cn (Z. Wang). 1 These authors contributed equally to this work.
Received Date:
9 February 2024 Revised Date:
28 March 2024 Accepted Date:
2 April 2024 Available Online:
3 April 2024
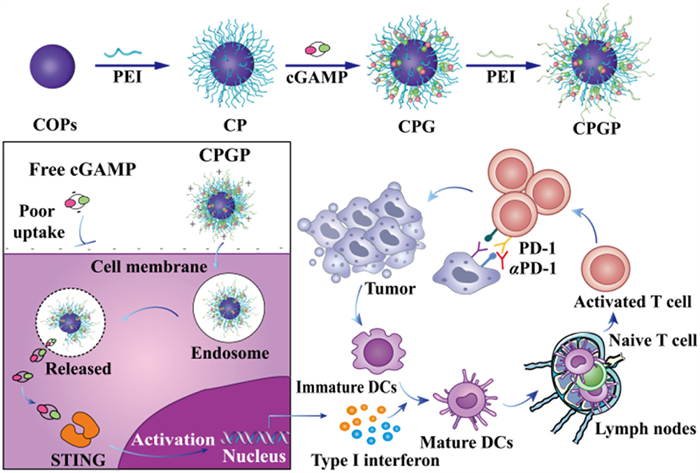
The cyclic guanosine monophosphate-adenosine monophosphate synthase and the stimulator of interferon genes (cGAS-STING) has emerged as a promising target for cancer immunotherapy. However, the development of natural STING agonists is impeded by several challenges, including limited biostability, poor pharmacokinetics, and inefficient cytosolic delivery. Herein, we meticulously designed a double-layer polyethylenimine (PEI) modified nanoscale covalent organic polymer (CPGP) for efficient delivery of 2′3′ cyclic guanosine monophosphate-adenosine monophosphate (cGAMP), a natural STING agonist. The double-layer PEI structured CPGP enhanced both the loading capacity and stability of cGAMP. Furthermore, CPGP improved the intracellular delivery efficiency and amplified the activation of STING pathway for the secretion of type-Ⅰ interferon and pro-inflammatory cytokines. In contrast, single-layered nanoparticles failed to permit stable loading and intracellular delivery of cGAMP for immune response. The nano-STING agonist also mitigated the immunosuppressive tumor microenvironment (TME) by reducing regulatory T cells and polarizing M2 macrophages to the M1 phenotype, thereby creating an immune-supportive TME to enhance adaptive immune responses. The combination of CPGP and immune checkpoint blockers showed synergistic effect, further enhancing the inhibition effect on tumor growth. This double-layer PEI modified CPGP may offer a generalizable platform for other natural dinucleotide STING agonists to overcome the cascade delivery barriers, augmenting immune activation for tumor immunotherapy.
Fluorescent lateral flow immunoassay (LFA) as the most common point-of-care testing (POCT) platform has attracted considerable attentions due to their advantages of rapidity, simplicity and low-cost [1-3]. It is worth emphasizing that fluorescence reporter mainly determines the analytical performance of LFA. Despite great efforts that have been devoted to develop numerous fluorescent probes, such as fluorescent organic dyes, quantum dots (QDs), upconversion nanoparticles (UCNPs), fluorescent probes reported so far generally have relatively poor performance caused by emission light located in the visible region (400–700 nm) [4-6]. These fluorescent probes usually suffer from relative low sensitivity and signal-to-noise ratio (S/N) owing to their higher light absorption as well as undesired autofluorescence from endogenous fluorophores (whole blood, plasma, urine, et al.) and nitrocellulose (NC) membrane of LFA, which are unfavorable for monitoring low-concentrated targets [7-9].
Fluorescence detection in the second near-infrared window (NIR-Ⅱ, 1000–1700 nm) has special superiority because of the low scattering and background autofluorescence [10-13]. Among the numerous NIR-Ⅱ fluorescent probes, rare-earth nanoparticles (RENPs) feature unique characteristics, such as large Stokes shift (> 200 nm), large absorption cross-section, sharp emission band, superior photostability, good chemical durability and ease of surface modification [14,15]. Although we have recently reported a new-type NIR-Ⅱ LFA platform based on RENPs probe (NaYF4: 7%Nd@NaYF4) for the detection of tumor biomarker in biological samples [16], RENPs probes used at present still encounter two inevitable problems in practical applications. (1) In this only Nd3+-doped RENPs, Nd3+ was employed as both the sensitizer and activator. NIR-Ⅱ fluorescence emission based on the only Nd3+-doped RENPs was realized through the intrinsic emission from Nd3+ after absorbing the excitation photons [14,17]. Due to Nd3+ had multiple excited states, the only Nd3+-doped RENPs showed unsatisfactory fluorescence quantum yield (QY < 10%) [18]. (2) the surface hydrophilic modification of RENPs is an absolutely essential part in the construction of LFA. However, it also remains a bottleneck to develop practical strategy to achieve surface hydrophilicity conversion. The common surface modification strategy was ligand exchange, suffering from the weaknesses of tedious and time-consuming treatment process, unavoidable aggregation of bare RENPs, leading to the decrease of luminescence intensity in some degree [19-23]. To further solve these problems for improving the performance of NIR-Ⅱ LFA, it still needs to take lots of efforts to develop diverse strategies for designing more efficient NIR-Ⅱ fluorescent probes.
In this work, we designed and synthesized an efficient NIR-Ⅱ probe based on the Nd3+ and Yb3+ doped RENPs by employing Nd3+ as energy donor and Yb3+ as energy acceptor. Due to the high energy transfer process from sensitizer ion Nd3+ to emitter ion Yb3+, this RENPs probe exhibited high ET efficiency and anti-interference capacity of background fluorescence. Meanwhile, relying on the convenient and efficient encapsulation action of PLGA microspheres to RENPs, the surface functionalized NIR-Ⅱ probe (RE@PLGA) was obtained for subsequent bioconjugation. By employing RE@PLGA as the fluorescent reporter, a novel NIR-Ⅱ LFA sensor was developed to detect α-fetoprotein (AFP), one kind of extremely important biomarkers for the diagnosis of hepatocellular carcinoma (HCC) [24]. The proposed NIR-Ⅱ LFA possessed advantages of high sensitivity, good reliability and rapid response. It is expected to be a powerful technique for POCT, which will further manifest its values in primary care, rapid diagnosis and massive screening.
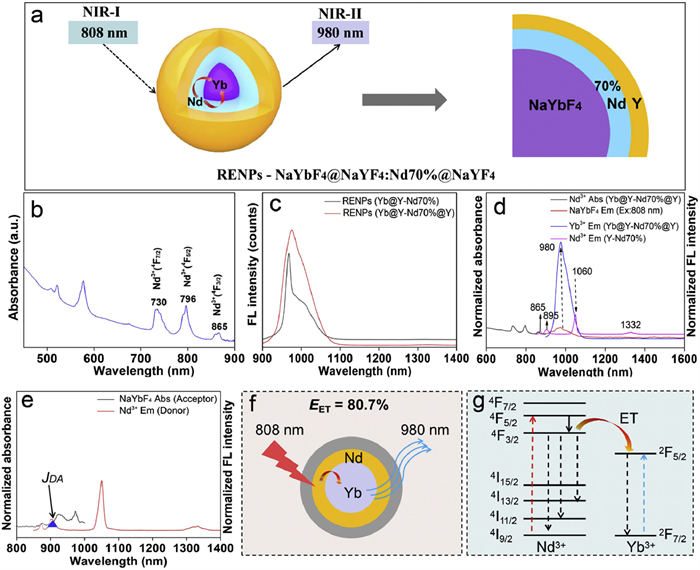
Previous researches have shown that it has high efficiency of energy transfer (up to 70%) between sensitizer ion Nd3+ and emitter ion Yb3+ in the Nd3+-sensitized Yb3+ system [25-27]. According to previous report, we synthesized the Nd3+ and Yb3+ doped RENPs with some modifications [22]. The schematic structure of RENPs presented an obvious core-shell structure, and its structural components were NaYbF4@NaYF4: Nd70%@NaYF4 (denoted as Yb@Y-Nd70%@Y) (Fig. 1a). Especially, NaYbF4 NPs, which acted as the only activators, were located in the inner core and could quickly receive energy from Nd3+ ions. Due to Nd3+ ion had a higher absorbance coefficient than Yb3+ ion, it served as the efficient light absorber and sensitizers, and its doping concentration was regulated over a large range (from 30% to 95%) [22]. To avoid harsh cross-relaxation effect by excessive doping concentration, the optimal doping concentration of Nd3+ ions (Nd70%) were distributed in the secondary outer layer (NaYF4: Nd70%). Furthermore, NaYF4 was coated at the outermost layer to protect inner sensitizer and activator from surface quenching.
Figure 1
Figure 1.
The inner ET mechanism of RENPs probe (Yb@Y-Nd70%@Y). (a) Structure illustration of RENPs. (b) Absorbance spectrum of RENPs, demonstrating multiple absorbance peaks including one at ~800 nm. (c) Fluorescence emission spectra of RENPs with FL emission peaks at ~980 nm, which were obtained using an 808 nm excitation laser. (d, e) Normalized NIR absorption and emission spectra of the only Nd3+-doped RENPs (Y-Nd70%), the only Yb3+-doped RENPs (NaYbF4) and the Nd3+ and Yb3+ doped RENPs (Yb@Y-Nd70%@Y), respectively. The shaded region JDArepresented the overlap region between the Nd3+ emission and the Yb3+ absorption spectra. (f) ET efficiency of RENPs. (g) Schematic illustration of ET mechanism between Nd3+ ion and Yb3+ ion of RENPs in the inner of RENPs probe.
The inner ET process of RENPs (Yb@Y-Nd70%@Y) probe was confirmed by the changes of NIR absorption spectra and fluorescence emission spectra of lanthanide ions (Nd3+/Yb3+)-doped RENPs. Absorption spectra of RENPs (Yb@Y-Nd70%@Y) showed three NIR absorption peaks, which located at 730, 796 and 865 nm, corresponding to transition from 4I9/2 state to 4F7/2, 4F5/2, and 4F3/2 states (Fig. 1b), and its NIR-Ⅱ fluorescent emission peak appeared at ~980 nm with 1.34-fold higher luminous intensity than that of RENPs (Yb@Y-Nd70%) under excitation of 808 nm laser (Fig. 1c). NIR emission peaks of the only Nd3+-doped RENPs (Y-Nd70%) were separately at 865 nm (4F3/2→4I9/2), 895 nm (4F3/2→4I11/2), 1064 nm (4F3/2→4I13/2) and 1332 nm (4F3/2→4I15/2) under the excitation of 808 nm light (Fig. 1d) [28,29]. NaYbF4 showed no fluorescence emission peak in NIR-Ⅱ region under 808 nm excitation. However, a complete disappearance in fluorescence emission peak (1064 nm) from Nd3+ ions and simultaneous appearance of fluorescence emission peak at ~980 nm from Yb3+ ions were observed in RENPs (Yb@Y-Nd70%@Y), and its NIR emitting brightness was 2.85-fold higher than that of the only Nd3+-doped RENPs (Y-Nd70%) at the same testing conditions (Fig. 1d). This phenomenon illustrated that the absorbed energy from the excitation light by Nd3+ ions have been effectively transferred to Yb3+ ions.
Occurrence mechanism of ET between Nd3+ ion and Yb3+ ion was further explored. Absorption spectra of NaYbF4 revealed an obvious NIR absorption peak at ~980 nm and the relative large absorption cross-section from 900 nm to 950 nm, respectively. Because there was an obvious spectral overlap between Nd3+ emission region and Yb3+ absorption region, it strongly favored Nd3+-to-Yb3+ energy transfer (Fig. 1e). The ET efficiency (EET) was defined as the percent of energy transferring from the donor (Nd3+ ion) to acceptor (Yb3+ ion) [30], and it was calculated as 80.7% for RENPs (Yb@Y-Nd70%@Y) (Fig. 1f), which was far higher than that of the most commonly used ET system [31]. More specifically, the photoluminescence (PL) process of RENPs (Yb@Y-Nd70%@Y) probe based on the inner ET mechanism was further described as follows: Thanks to large absorption cross-section of Nd3+ ions, high Nd3+-doped nanocrystals (Nd70%) as an efficient energy donor could absorb the excitation energy under 808 nm laser excitation, and then Nd3+ transferred photons with the generation of electrons from the 4I9/2 ground state to the 4F5/2, followed by a non-radiation transition to its 4F3/2 state. The emission energy was effectively transferred to the energy acceptor Yb3+via 4F3/2 (Nd3+) + 2F7/2 (Yb3+) → 4I9/2 (Nd3+) + 2F5/2 (Yb3+), and then populated the 2F5/2 state of Yb3+, generating strong FL emission at ~980 nm (Fig. 1g) [17,22].
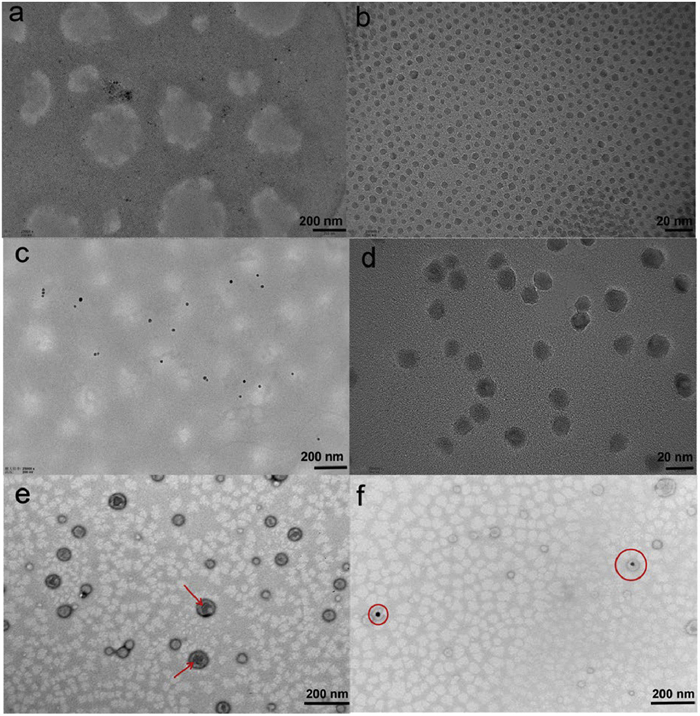
The synthesized RENPs were surface-modified by the convenient and effective encapsulation strategy of PLGA microspheres for bioconjugation. The preparation process of RE@PLGA microspheres was displayed in Supporting information (Figs. S1 and S2 in Supporting information), and it was further characterized by different techniques. TEM images showed the typical features of RENPs, PLGA and RE@PLGA microspheres. RENPs core (NaYbF4) exhibited a regular spherical structure (Figs. 2a and b) and the average particle size was determined as 6.8 nm by the dynamic light scattering (DLS) (Fig. S3a in Supporting information). The average diameter of RENPs (Yb@Y-Nd70%) was detected as 13.5 nm by DLS, and it could be calculated that the inner shell thickness (Y-Nd70%) was about 6.7 nm (Fig. S3b in Supporting information), which well meets the spatial distance requirement (< 10 nm) of ET. TEM image of RENPs (Yb@Y-Nd70%@Y) also displayed a monodisperse spherical structure (Figs. 2c and d) with the average particle size 25.0 nm measured by DLS, which could be confirmed that the outer coating thickness (NaYF4) was about 11.5 nm (Fig. S3c in Supporting information). TEM image of PLGA microsphere showed regular sphericity with an internal cavity (Fig. 2e), and its average diameter was 121.1 nm detected by DLS (Fig. S3d in Supporting information). For RE@PLGA microspheres, it was obviously seen that one or more RENPs (n = 1–4) had been encapsulated at the cavity of PLGA microspheres (Fig. S4 in Supporting information), and the formed RE@PLGA microspheres displayed relatively irregular spherical structure (Fig. 2f) with the mean size of 180 ± 40 nm (Fig. S3e in Supporting information). Moreover, the zeta potential of PLGA and RE@PLGA were -6.8 mV and -4.1 mV ± 1.5 mV, respectively (Fig. S5 in Supporting information). Negative potentials of two kinds of microspheres were due to the presence of carboxyl groups on the surface. After modification with AFP detection antibody, the hydrodynamic diameter of RE@PLGA-Ab reached 588.8 nm and its zeta potential was -9.46 mV, exhibiting obvious changes (Fig. S6 in Supporting information).
Figure 2
Figure 2.
Morphology characterization of RENPs and RE@PLGA. (a, b) TEM image of NaYbF4. (c, d) TEM image of RENPs (Yb@Y-Nd70%@Y). (e) TEM image of PLGA microspheres. Red arrow points to its inner cavity. (f) TEM image of RE@PLGA microspheres.
The surface structure of RE@PLGA was firstly confirmed by Fourier infrared transform spectroscopy (FT-IR), which was shown in Supporting information (Fig. S7 in Supporting information). Moreover, the chemical compositions of RE@PLGA were further confirmed by energy dispersive X-ray (EDX) spectroscopy. It was clear that RE@PLGA contained C, O, F, Y, Nd and Yb elements. The inset table exhibited the contents of every element. Elemental mapping images revealed that three elements (F, Y and Nd) were brightly colored, demonstrating the existence of these elements at the outer shell of RENPs. Yb element looked dull in color, confirming it lied in the core of RENPs. C and O elements were relatively evenly distributed, indicating that the coexistence of RE@PLGA and PLGA microspheres (Fig. S8 in Supporting information). Furthermore, RE@PLGA microspheres also exhibited excellent physical stability and photostability (Fig. S9 in Supporting information). Encapsulation efficiency (EE) of PLGA microspheres to RENPs reached 88.8%, which provided a convenient and efficient encapsulation strategy (Fig. S10 in Supporting information).
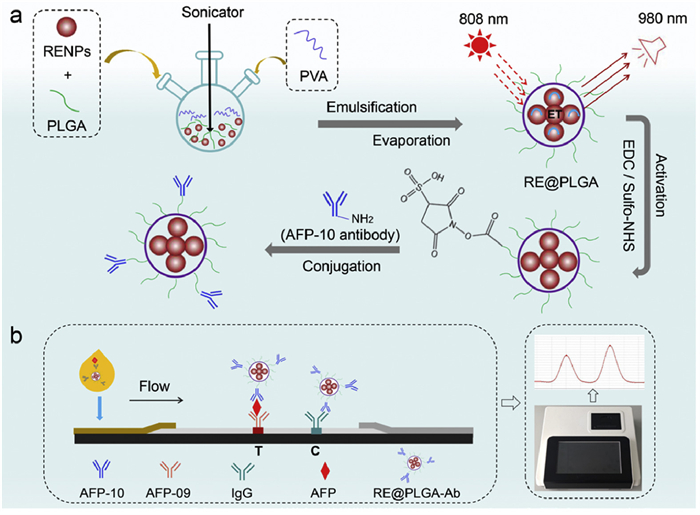
Principle of NIR-Ⅱ probe-based LFA was explained as follows: With the high ET efficiency and superior optical performance, RENPs (Yb@Y-Nd70%@Y) probe is critical for realizing high-sensitive and accurate detection of tumor biomarkers in that it is able to avoid the background interference from biological samples. From Scheme 1, AFP coating antibodies (AFP-09) set as test line (T line) and IgG as control line (C line) had been sprayed on the nitrocellulose (NC) membrane, respectively. Biological samples containing AFP and RE@PLGA-Ab solution were premixed and then added into the sample well of detection card, followed by adding with sample buffer. Sample liquid flew along the test strip to the NC membrane, and the formed immune complex (RE@PLGA-Ab-AFP-10) specifically reacted with AFP coating antibody, forming a sandwich structure (RE@PLGA-Ab-AFP-AFP09) at T line. The surplus RE@PLGA-Ab complex was non-specifically bound to IgG immobilized on the C line as a quality control signal. Under the excitation light of 808 nm, the generated NIR-Ⅱ fluorescent emission signals (980 nm) at T line and C line were recorded by NIR-Ⅱ fluorescence immune analyzer, respectively. Under the optimal conditions, AFP concentrations and ratios (T/C) of FL intensity at 980 nm presented a good linear relationship, which would provide a rapid, sensitive and accurate method for the quantitative detection of AFP in biological samples.
Scheme 1
Scheme 1.
Design scheme of LFA sensor based on the efficient NIR-Ⅱ probe. (a) Preparation progress of RE@PLGA microsphere and its antibody conjugation process. (b) Schematic diagram describing NIR-Ⅱ LFA for detection of AFP.
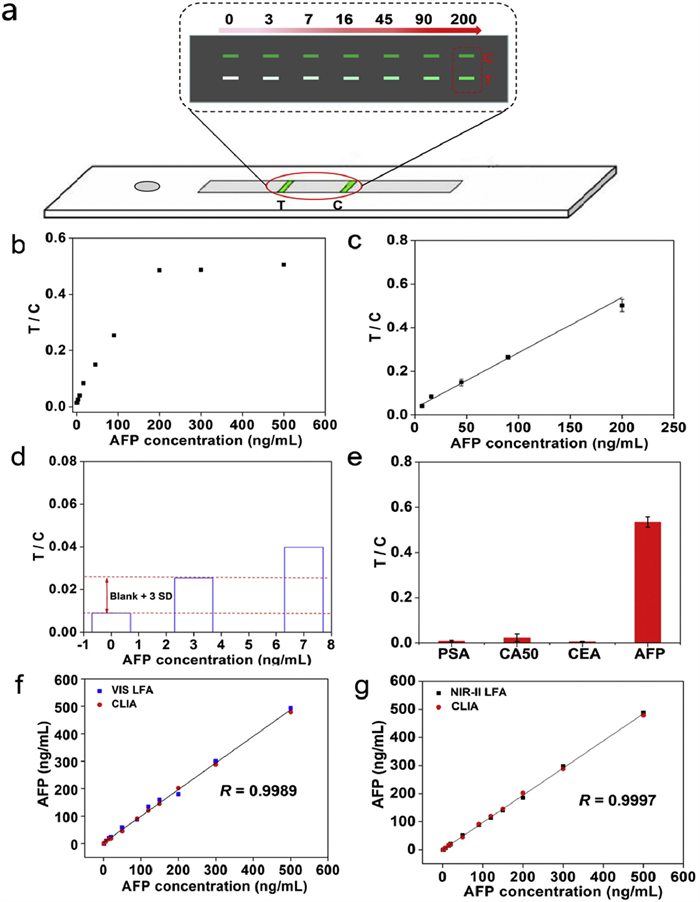
Optimization of immunoreaction condition is the key parameter to improve the detection performance of NIR-Ⅱ LFA, and the detailed progress had been displayed in Supporting information (Figs. S11-S17 in Supporting information). Under the optimal conditions, a novel LFA sensor based on the efficient NIR-Ⅱ probe was developed for the determination of AFP. As the increasing concentrations of AFP, the fluorescence intensity ratio (T/C) increased gradually. AFP concentrations and T/C values displayed a good linear relationship from 7.0 ng/mL to 200 ng/mL (y = 0.0023x + 0.0413, R = 0.9923) (Figs. 3a–c). The limit of detection (LOD) was estimated to be 3.0 ng/mL, which was of 8.3 times lower than the clinical cutoff values (25 ng/mL) (Fig. 3d) [32]. Moreover, compared with previously reported detection methods, the proposed NIR-Ⅱ LFA also exhibited good sensitivity and relative wide linear detection range (Table S1 in Supporting information).
Figure 3
Figure 3.
Analytical performance of LFA sensor based on the efficient NIR-Ⅱ fluorescent probe. (a) NIR-Ⅱ imaging of LFA test strips with different concentrations of AFP from 0 to 200 ng/mL. (b) T/C value changes with increasing concentrations of AFP. (c) Calibration curve for T/C values versus AFP concentrations (n = 5). (d) The limit of detection of NIR-Ⅱ LFA. It was calculated by the blank intensity plus three folds standard deviation. (e) Analytical specificity of NIR-Ⅱ LFA towards AFP and other tumor biomarkers (n = 5). (f) Correlation coefficient between Roche CLIA and the VIS LFA method. (g) Correlation coefficient between Roche CLIA and the developed NIR-Ⅱ LFA method.
The specificity of NIR-Ⅱ LFA was estimated by adding four kinds of tumor biomarkers (AFP, CEA, PSA and CA50), respectively. The cross reactivity (CR) was calculated to assess the specificity of the method. When high concentration of tumor biomarkers (200 ng/mL) were added into the prepared NIR-Ⅱ LFA test strips, only the T/C value of AFP was high (0.534). T/C values of other tumor biomarkers (CEA, PSA, CA50) were below 0.02, and the corresponding CR were also no more than 1.5%. It indicated that these interfering substances had little effect on the detection process of NIR-Ⅱ LFA, exhibiting excellent specificity (Fig. 3e). Owing to the selective recognition ability of antibody mainly determined the specificity of method, it also proved that the prepared NIR-Ⅱ probe (RE@PLGA-Ab) possessed good selectivity.
The reproducibility of NIR-Ⅱ LFA was evaluated by recovery rates, intraday and interday variations. From Table S2 (Supporting information), the recovery rates from the mimical serum samples spiked with different concentrations of AFP ranged from 93.6% –110.6% with coefficients of variation (CV) below 10%, and the interday CV was also lower than 14%, indicating excellent accuracy and precision. In addition, the prepared NIR-Ⅱ LFA test strips were placed at oven (45 ℃, 7 days) to explore the storage stability. From Table S3 (Supporting information), the recovery rates ranged from 90.0% to 108.5% in 7 days at high ambient temperature (45 ℃). Meanwhile, the intraday CV was lower than 10.0% and the interday CV was also no more than 15.0%. These results showed that the prepared NIR-Ⅱ LFA test strips had good stability and durability.
Chemiluminescent immunoassay (CLIA) was employed as control to further evaluate the validity and reliability of NIR-Ⅱ LFA. Twelve serum samples determined by Roche CLIA (linear range: 0.5–1000 ng/mL), the commercial AFP kit (linear range: 10–200 ng/mL, detection with visible fluorescence) and the proposed NIR-Ⅱ LFA method (linear range: 7.0–200 ng/mL), respectively. The sample test results were firstly carried out a statistical analysis by SPSS software. It showed that whether the NIR-Ⅱ LFA and CLIA or the VIS LFA and CLIA, there were no significant differences (P > 0.05), which indicated that the developed NIR-Ⅱ LFA for AFP detection is reliable. The consistency analysis of test results of three methods was further carried out. From Figs. 3f and g, the correlation coefficient (R) between VIS LFA and CLIA was 0.9989, and the correlation coefficient between NIR-Ⅱ LFA and CLIA reached 0.9997. Compared with VIS LFA, the developed NIR-Ⅱ LFA was in better agreement with CLIA, which indicated that the proposed LFA sensor based on the efficient NIR-Ⅱ probe has more excellent accuracy and validity in the quantitative determination of AFP in clinical serum samples.
In summary, we have developed a novel LFA sensor based on the efficient NIR-Ⅱ fluorescent probe for detection of tumor biomarkers (AFP as a model analyte). The proposed RENPs probe possesses three unique advantages, giving great prospects for clinical translation. Firstly, the low preparation cost and the controllable preparation progress make it easy for large-scale production. Secondly, the sensitizer ions Nd3+ and emitter ions Yb3+ constructed an energy transfer highway in the inner of RENPs, generating excellent fluorescence efficiency. Thirdly, the encapsulation strategy of PLGA microspheres easily realized the surface modifications of RENPs, which will contribute to bioconjugation. Thanks to its superior anti-interference capability and fluorescence property of NIR-Ⅱ probe, the proposed NIR-Ⅱ LFA sensor has the ability to realize background-free detection of tumor biomarkers in clinical serum sample with good sensitivity and wide linear range. This LFA sensor can serve as a powerful tool for early diagnosis and mass screening of tumor biomarkers in POCT.
Declaration of competing interest
The authors declare that they have no known competing financial interests or personal relationships that could have appeared to influence the work reported in this paper.
Acknowledgments
This work was supported by the National Natural Science Foundation of China (Nos. U2267221, 22107029, 22377135), the Bohai Rim Advanced Research Institute for Drug Discovery (No. LX215002), the Natural Science Foundation of Shandong Province (No. ZR2022QH212), the Taishan Scholars Program (No. tsqn202312305), the Young Elite Scientists Sponsorship Program by Chinese Chemical Society, the Fundamental Research Projects of Science & Technology Innovation and development Plan in Yantai City (No. 2023JCYJ059), the Shandong Laboratory Program (No. SYS202205) and the Shanghai Postdoctoral Excellence Program (No. 2023704).
Supplementary materials
Supplementary material associated with this article can be found, in the online version, at doi:10.1016/j.cclet.2024.109834.
Scheme 1. Schematic overview of the fabrication of CPGP and its mechanism for STING activation and immune responses.
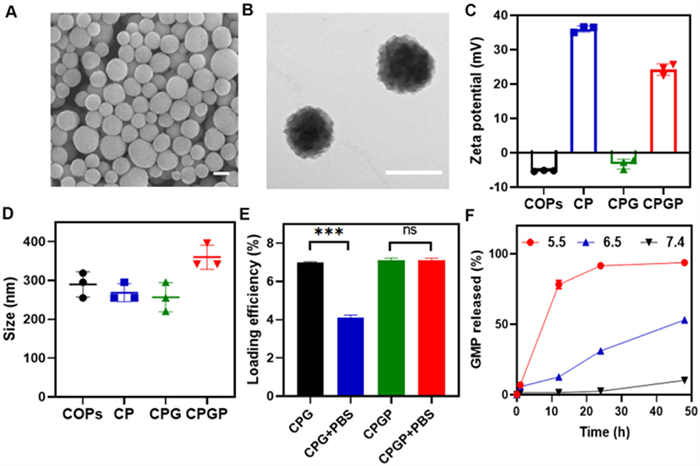
Figure 1. (A) SEM image of CPGP. Scale bar: 200 nm. (B) TEM image of CPGP. Scale bar: 200 nm. (C) Zeta potential of COPs, CP, CPG, and CPGP. (D) The diameter of COPs, CP, CPG, CPGP determined by dynamic light scattering. (E) Loading efficiency of cGAMP with CPG or CPGP in PBS buffer. (F) The release curve of GMP at different time points. Data represent means ± SD (n = 3). ***P < 0.001. ns: no significant difference.
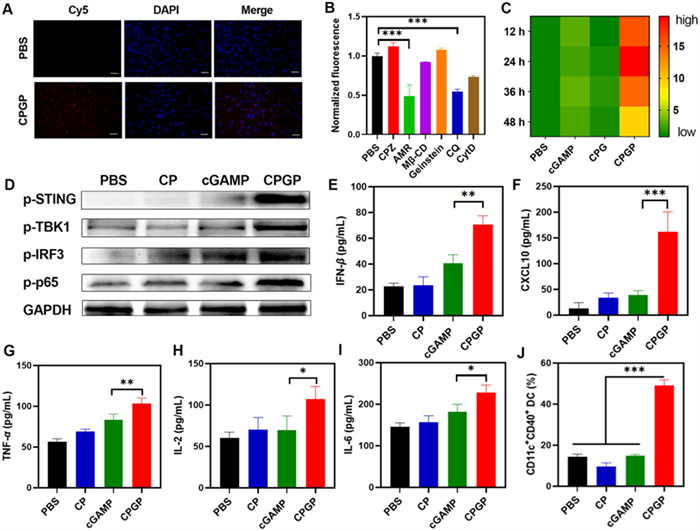
Figure 2. (A) Intracellular uptake of CPGP in DC2.4 cells after 24 h incubation. Red: Cy5; Blue: 4′,6-diamidino-2-phenylindole (DAPI). Scale bar: 50 µm. (B) Flow cytometry analysis of endocytosis mechanism of CPGP. (C) STING pathway activation of CPGP in RAW-Lucia™ ISG cells. (D) Detection of p-IRF3, p-TBK1, p-p65, and p-STING protein in BMDCs by Western blot analysis. (E–I) Secretion of IFN-β (E), CXCL10 (F), TNF-α (G), IL-2 (H), and IL-6 (I) in medium after co-incubation CPGP with BMDCs for 24 h. (J) The maturation of BMDCs (CD40+) with various treatments. Data represent means ± SD (n = 5). *P < 0.05, **P < 0.01, ***P < 0.001.
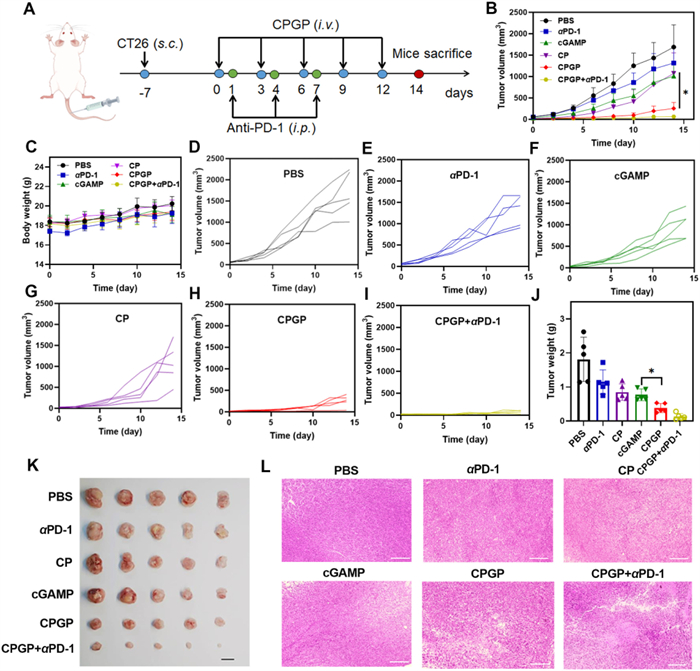
Figure 3. (A) The establishment of subcutaneous CT26 tumors and therapeutic scheme by different formulations. (B, C) Overall tumor growth (B) and body weight (C) of the mice during the treatment period. (D–I) Tumor growth curves of the mice at different groups, respectively. (J) Tumor weight after different treatments. (K) Tumor image of the mice at the end of the treatments. Scale bar: 1 cm. (L) H&E staining of tumor tissues treated by various formulations. Scale bar: 50 µm. Data represent means ± SD (n = 5). *P < 0.05.
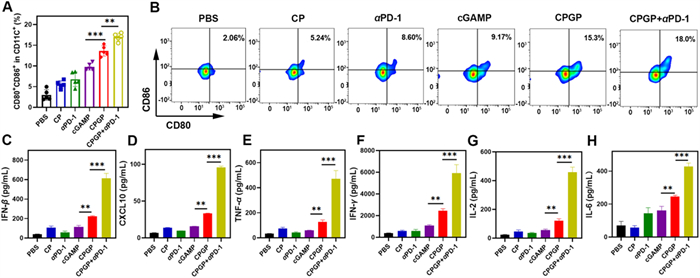
Figure 4. (A, B) Representative fluorescence-activated cell sorting plots and quantitative analysis of CD80+CD86+ in tumor-draining lymph nodes. (C-H) The secretion of IFN-β (C), CXCL10 (D), TNF-α (E), INF-γ (F), IL-2 (G), and IL-6 (H) intratumoral cytokines in mice treated with different formulations. Data represent means ± SD (n = 5). **P < 0.01, ***P < 0.001.
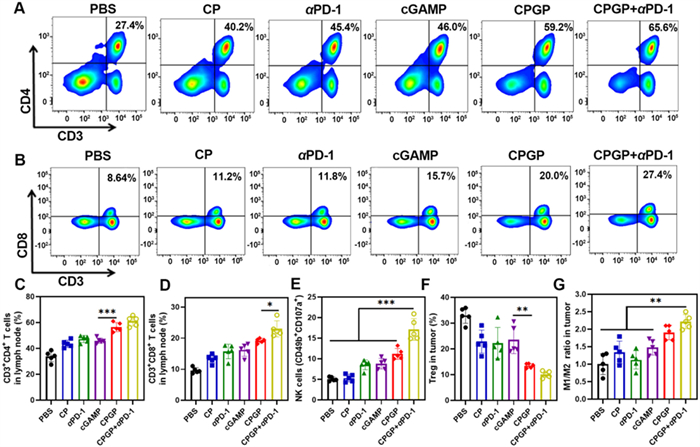
Figure 5. (A–D) Representative fluorescence-activated cell sorting plots and quantitative analysis of CD4+ T cells and CD8+ cytotoxic T cells in tumor-draining lymph nodes. (E) Percentages of CD107a+ NK cells in tumor-draining lymph nodes. (F) Representative flow analyses and quantification of the ratio of Tregs (CD4+ Foxp3+ T cells) in tumor. (G) The ratio of M1/M2-type of macrophages in tumor. Data represent means ± SD (n = 5) *P < 0.05, **P < 0.01, ***P < 0.001.

 Login In


 DownLoad:

 DownLoad: