Department of Neurosurgery and Institute of Neurosurgery, State Key Laboratory of Biotherapy and Cancer Center, West China Hospital, West China Medical School, Sichuan University, Chengdu 610041, China
b.
West China School of Basic Medical Sciences&Forensic Medicine, Sichuan University, Chengdu 610041, China
c.
Department of Hematology, West China Hospital, Sichuan University, Chengdu 610041, China
* Corresponding authors. E-mail addresses: wangjie@wchscu.cn (J. Wang), xianggao@scu.edu.cn (X. Gao). 1 These authors contributed equally to this work.
Received Date:
29 January 2024 Revised Date:
13 March 2024 Accepted Date:
14 March 2024 Available Online:
15 March 2024
FMS-like tyrosine kinase 3 (FLT3) is a viable and important therapeutic target for acute myeloid leukemia (AML). FLT3 internal tandem duplication (FLT3-ITD) mutations have been identified in approximately 30% of AML patients, and are associated with unfavorable prognosis, higher risk of relapse, drug resistance, and poor clinical outcome. Even FLT3 inhibitors have demonstrated promising efficacy, they cannot cure AML or even significantly extend the lives of patients with FLT3-ITD mutations. This is partly because of poor water solubility, insufficient membrane penetration and short half-life of small molecule inhibitors. Besides, the presence of enzymes like CYP3A4 in bone marrow accelerate the elimination and metabolism of FLT3 inhibitors, resulting in low plasma concentrations and side effects. Here we report the erythrocyte membrane-camouflaged FLT3 inhibitor nanoparticles to enhance FLT3-ITD AML treatment. Briefly, we physically coextruded red blood cell (RBC) membrane vesicles with nanoparticles derived from FLT3 inhibitor F30 to obtain F30@RBC-M, which exhibited comparable potent FLT3-ITD inhibitory effects compared to free F30in vitro, while displaying a higher potent antitumor efficacy in xenograft models due to the prolonged circulation properties. Furthermore, administration of F30@RBC-M significantly extended the survival of mice in a transplanted mouse model than F30 free drug. These findings suggest that RBC membrane-coated nanoparticles derived from FLT3 inhibitors hold promise as a tool to enhance the therapeutic efficacy to treat FLT3-ITD AML.
Attribute to high power density, and long cycle life, electric double-layer capacitors (EDLCs) or supercapacitors (SCs) are becoming very promising in the fields that need high power output, such as electric vehicles, and military equipment [1-4]. Nowadays, most electrolytes for commercial SCs use organic solvents such as acetonitrile (AN) for the wider electrochemical stability voltage window which offers a higher energy density and better cycle stability [5, 6]. However, the ionic conductivity of the organic electrolyte is not satisfied, which leads to the relatively high equivalent series resistance (ESR) and low power density of the SCs. Also, most organic electrolytes are poisonous, flammable, expensive, and ecologically unfriendly. Moreover, organic electrolytes need specific, severe manufacturing conditions (strict waterfree and oxygen-free conditions). As a contrast, aqueous electrolytes are nonflammable, nontoxic, environmentally friendly, and low-costed. Their high ionic conductivity and small ion size endow aqueous SCs with excellent electrochemical performances (high specific capacitance, low ESR, and high power density), which fulfill the needs of future development of SCs [7, 8].
Nevertheless, aqueous electrolytes have a narrow electrochemical window (most of them ≤ 1.23 V) [9], which limits the energy density and the practical applications of aqueous SCs. Therefore, many research focused on improving the electrochemical stability of aqueous electrolytes. The neutral salt solutions such as Li2SO4
[10, 11], Na2SO4 [12, 13], and KCl [14] were proved to be able to run at higher voltages than aqueous acidic or alkali electrolytes. However, subject to the strong hydration of the ions, the rate performances of SCs using these neutral salts solutions are not satisfying [15]. Most recently, a kind of in situ electrodeposited poly (vinyl alcohol) potassium borate (PVAPB) hydrogel electrolyte (HGE) with excellent electrochemical stability was developed [16, 17]. It showed not only high operation voltage (2 V) but also excellent rate performance in the symmetric activated carbon (AC) SCs. The HGE structure also avoided the weaknesses of liquid aqueous electrolytes (internal corrosion, leaking, and complicate packaging), and made it possible to build flexible SCs.
Besides the electrochemical performance, the temperature stability was another important property of electrolytes, which directly affected the operating temperature range of SCs. The liquid electrolytes would be inactive when their solvents began to freeze or boil. Therefore, the operating temperature range of liquid electrolytes was mainly determined by the solvents they used [18].The freezing point of water is higher than those of most organic solvents, so the low-temperature stability of most aqueous electrolytes are inferior to those of organic electrolytes [8]. As to the HGEs, the states of water in them are not the same as those of water in liquid aqueous electrolytes, and some polymer gel skeletons are not stable in certain temperature ranges, so their temperature failure mechanisms might be different from those of normal liquid aqueous electrolytes [19].
As a new high voltage HGEs for SCs, the PVAPB HGE presents an exceptional ionic transport mechanism, and the water molecules in PVAPB HGE was speculated to ionize and restore during charging and discharging processes of SCs [17]. Thus, the temperature stability of PVAPB HGE might be quite different from those of liquid aqueous electrolytes. In this study, the AC/PVAPB HGE/AC SCs were fabricated and tested at various temperatures (from -5 ℃ to 80 ℃). The results were compared with the SCs using liquid aqueous electrolytes to examine the temperature stability of PVAPB HGEs.
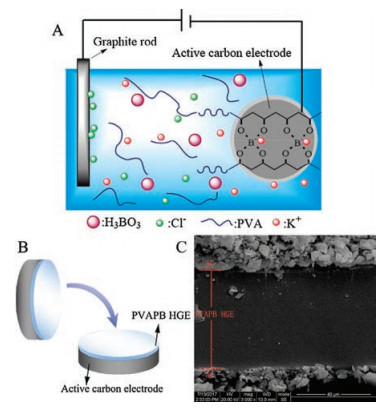
The AC/PVAPB HGE/AC SCs were fabricated according to the following steps. First, PVA (10 g), boric acid (1.75 g), KCl (33.55 g, 0.45 mol) were dissolved in about 450 mL deionized water at 95 ℃. Then the solution was cooling down to 40 ℃, and additional deionized water was added to form 500 mL electrodeposition solutions with 0.9 mol/L of K+ ions. Then the AC electrodes were immersed in this electrodeposition solution, and cathodic electrodeposited with graphite rode anode at 2.75 V for 3 min. As a result, PVAPB HGEs were prepared on the surface of AC electrodes, as shown in Fig. 1A. After electrodeposition, the surfaces of wet PVAPB HGEs were treated with dry filter paper to remove excessive electrodeposition solution. Finally, AC electrodes covered with PVAPB HGEs were assembled into CR 2032 coin-type cell to build symmetric SCs. During the cell assembling, the two working electrodes were placed with the sides covered with PVAPB HGEs facing each other. No additional separator or liquid electrolyte was added during cell assembling, as shown in Fig. 1B. For comparison, the SCs control samples were prepared by using 0.9 mol/L KCl aqueous solution (the same KCl concentration was used in preparing the PVAPB HGEs) and 1 mol/L Na2SO4 aqueous solution (the widely used electrolyte in aqueous high-voltage SCs) as the liquid electrolytes and glass microfiber membrane as the separator.
图 1
图 1
(A) Schematic of in situ electrodeposition of PVAPB HGE on AC electrode. (B) Schematic of fabrication of symmetric SCs. (C) SEM image of the cross-section of PVAPB HGE layer.
Figure 1.
(A) Schematic of in situ electrodeposition of PVAPB HGE on AC electrode. (B) Schematic of fabrication of symmetric SCs. (C) SEM image of the cross-section of PVAPB HGE layer.
The cross-section morphology structure of PVAPB HGE between the two AC electrodes was observed with JSM-5900LV scanning electron microscopy (SEM) (JEOL Ltd., Japan). And its SEM image was shown in Fig. 1C. It was found that the PVAPB HGE layer was smooth and intact with the thickness of about 50 μm. The PVAPB HGE closely attached on the AC electrode, and the interface between them was tight and compact, which could provide the SCs with low interface resistance and good electrochemical performance.
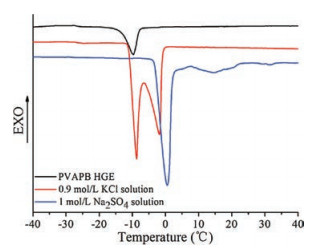
The stability of aqueous SCs at low temperature mainly depends on the freezing point of the electrolyte. Therefore, The PVAPB HGE and the liquid electrolytes (0.9 mol/L KCl and 1 mol/L Na2SO4) were analyzed with differential scanning calorimetry (DSC) (NETZSCH DSC 204 F1, Germany) to observe their temperature stability. DSC samples (5–8 mg) were sealed in aluminum pans and then cooled to -40 ℃ at a rate of 10 ℃/min in a nitrogen atmosphere. After the freezing process, the samples were heated to 40 ℃ at a speed of 2 ℃/min. DSC diagrams of PVAPB HGE, 0.9 mol/L KCl, and 1 mol/L Na2SO4 electrolytes were shown in Fig. 2 to compare their thermal properties at low temperature. There was one endothermic peak at about 0.57 ℃ in DSC diagram of 1 mol/L Na2SO4 solution, which was attributed to the fact that saturated Na2SO4 solution would hardly change the freezing point of water [20]. By contrast, KCl salt had a higher solubility than Na2SO4 salt in water at low temperature, resulting in the phenomenon that the addition of KCl salt would obviously impact on the freezing point of water. There were two endothermic peaks at about -8.7 ℃ and -1.9 ℃ in the DSC diagram of 0.9 mol/L KCl solution. The peak at -8.7 ℃ was attributed to the freezing of water molecules that interacted with K+ and Cl- ions, and that at -1.9 ℃ indicated the free water molecules in 0.9 mol/L KCl solution. As for PVAPB HGE, There was only one endothermic peak at about -9.4 ℃ in its DSC diagram, which was different from that of 0.9 mol/L KCl solution. It indicates that the water molecules in PVAPB HGEs are mainly in bonding state. These bonding water molecules produced by the strong hydrogen bond interaction between water molecules and PVA in PVAPB HGEs may not even be frozen, which can reduce the freezing point of PVAPB HGE. The lowest freezing point of PVAPB HGE suggested that it should be more stable than other liquid aqueous electrolytes at low temperature.
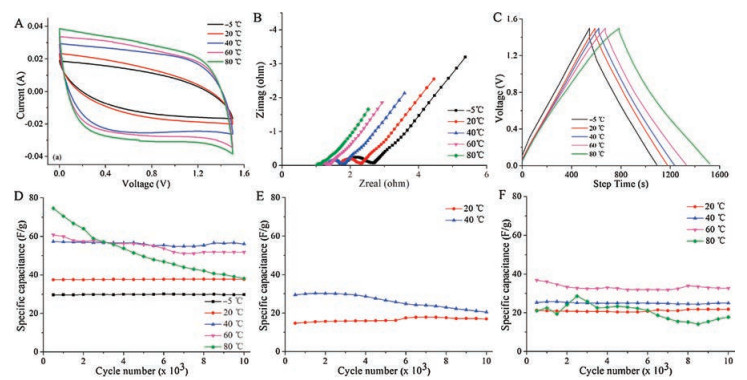
The electrochemical performances of the SCs using different aqueous electrolytes were all evaluated from -5 ℃ to 80 ℃. The test voltage ranges were set as 0–1.5 V for PVAPB HGE and 1 mol/L Na2SO4, and 0–1.1 V for 0.9 mol/L KCl (because of its relatively narrow electrochemical window). Cyclic voltammetry (CV) and electrochemical impedance spectroscopy (EIS) measurements were carried out by the CHI660E electrochemical workstation. The charge-discharge tests were performed on LANHE CT2001A supercapacitor test system. The SC samples were kept at the experimental temperatures for 2 h before tests to accomplish the temperature equilibrium. It could be seen from Fig. 3A that the CV curves of the PVAPB HGE SCs had a much better rectangular profile than those of SCs with liquid aqueous electrolytes (Fig. S1 in Supporting information), which indicated its better capacitive behavior. With the increase of the operating temperature, the specific capacitance of all the SCs increased, and the specific capacitance of the SC assembled with PVAPB HGE was greater than those of the SCs assembled with liquid aqueous electrolytes. All the SCs would lose function below -5 ℃ or beyond 80 ℃. The SCs using PVAPB HGEs could stably operate from -5 ℃ to 80 ℃, but the SCs with 0.9 mol/L KCl and 1 mol/L Na2SO4 stopped working at -5 ℃, which indicated that the low-temperature stability of PVAPB HGE was better than those liquid aqueous electrolytes because of the unique bonding state of water molecules in PVAPB HGE. Fig. 3B showed the Nyquist plots of the PVAPB HGE SCs measured from 106 Hz to 10-1 Hz at different temperatures, which displayed a typical capacitive behavior. It was found that the bulk resistances (Rb) of PVAPB HGE is higher than that of 0.9 mol/L KCl but smaller than that of 1 mol/L Na2SO4 (Fig. S2 in Supporting information). The Rb and the charge transfer resistances (Rct) of all the SCs decreased with the increase of temperature. It could be seen that the Rb and Rct of SCs using 1 mol/L Na2SO4 were most sensitively affected by the temperature, while those of SCs using 0.9 mol/L KCl seemed insensitive to the temperature, and the influence of the temperatures on the SCs using PVAPB HGE was medium. These phenomena can be explained by the hydration of ions in the electrolytes. The hydrated ions are very sensitive to the temperature, and high temperature will lower the hydration numbers of ions, which is a benefit for the mobility of the ions. Na2SO4 has stronger hydration than KCl, so its ionic conductivity is more temperature-sensitive than that of KCl. The ions in PVAPB HGE cannot be simply described as hydrated ions, but the result still indicated that higher temperature is more suitable for the ion mobility in the PVAPB HGE.
图 3
图 3
(A) CV curves o the PVAPB HGE SCs with a scan rate of 10 mV/s at different temperatures. (B) The Nyquist plots of the PVAPB HGE SCs at different temperatures. (C) The galvanostatic charge-discharge curves of the PVAPB HGE SCs with the current density of 0.1 A/g at different temperatures. The cycle life of the PVAPB HGE SCs (D), KCl SCs (E), Na2SO4 SCs (F) at the different operating temperature.
Figure 3.
(A) CV curves o the PVAPB HGE SCs with a scan rate of 10 mV/s at different temperatures. (B) The Nyquist plots of the PVAPB HGE SCs at different temperatures. (C) The galvanostatic charge-discharge curves of the PVAPB HGE SCs with the current density of 0.1 A/g at different temperatures. The cycle life of the PVAPB HGE SCs (D), KCl SCs (E), Na2SO4 SCs (F) at the different operating temperature.
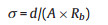
The ionic conductivity σ of electrolytes at different temperatures can be calculated as follows:
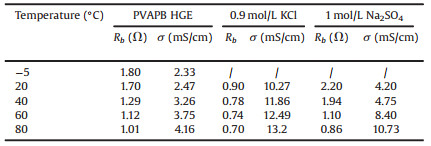
Where A is the surface area of electrodes; d is the distance between the positive and negative electrodes (the thickness of the PVAPB HGE, KCl electrolyte, and the Na2SO4 electrolyte is about 50 μm, 110 μm, and 110 μm, respectively.); Rb is the bulk resistances of the electrolytes. The Rb and σ calculated from Fig. 3B and Fig. S2 were shown in Table 1.
表 1
表 1Rb and σ of the electrolytes at different temperatures.
Table 1.Rb and σ of the electrolytes at different temperatures.
The temperature dependence of the conductivity of electrolyte follow the Arrhenius equation: σ = σ0exp(-Ea/RT), where σ0 is the pre-exponential factor; Ea is the activation energy; T is the absolute temperature, and R is the gas constant. The plot of lnσversus 1/T for three kinds of electrolytes was shown in Fig. S3 (Supporting information). From the slope of the linear fit line of lnσversus 1/T plot, the Ea of PVAPB HGE, 0.9 mol/L KCl, and 1 mol/L Na2SO4 were calculated to be 5.81 kJ/mol, 3.52 kJ/mol and 14.44 kJ/mol, respectively. The relatively low Ea of PVAPB HGE indicates its excellent temperature stability. The galvanostatic charge-discharge curves of PVAPB HGE SCs in Fig. 3C behave as a mirror-like shape during the charge-discharge process, which means that the SCs using PVAPB HGEs own a favorable electrochemical capacitance performance in wide temperature region. However, the charge-discharge curves of SCs using liquid aqueous electrolytes (Fig. S4 in Supporting information) show distorted shapes especially at low temperatures, which indicates their poor reversibility at low temperatures. It is noticeable that the SCs using 0.9 mol/L KCl failed in the galvanostatic charge-discharge test at 60 ℃ and 80 ℃, though it could run in the CV test at the same temperatures. The reason comes from that the activity of the water molecules in 0.9 mol/L KCl solution increased at high temperature, which lowers down its electrochemical stability and made 0.9 mol/L KCl SCs stop running at high temperature [21]. The water molecules in 1 mol/L Na2SO4 also has a similar tendency at high temperature, but the strong hydration of Na2SO4 salt could still keep its electrolyte stable at 60 ℃ and 80 ℃.
The long-term cycle performance tests were employed at the current density of 0.5 A/g from -5 ℃ to 80 ℃ to further examine the stability of the SCs at different temperatures. Results were shown in Figs. 3D–F. It was found that 0.9 mol/L KCl SCs had relatively low specific capacitance and poor cycle performance, compared with PVAPB HGE SCs and 1 mol/L Na2SO4 SCs. Although the cyclic stability of 1 mol/L Na2SO4 SCs was as good as that of PVAPB HGE SCs, its specific capacitance was far lower than that of PVAPB HGE SCs. The capacitance of both PVAPB HGE SCs and Na2SO4 SCs dropped a lot during cycle test at 80 ℃, which may be caused by the drastic water evaporation at 80 ℃ in the electrolyte. The capacitance attenuation of the PVAPB HGE SCs was hardly observed at -5 ℃, 20 ℃, and 40 ℃, which indicates its excellent reversibility in wide temperature range, and potential application in the relatively extreme environment.
In summary, the electrochemical performance of the AC/AC SCs assembled with in situ electrodeposited PVAPB HGEs, and liquid aqueous electrolytes (0.9 mol/L KCl and 1 mol/L Na2SO4) were systematically studied in a wide temperature range from -5 ℃ to 80 ℃. In general, as a new aqueous electrolyte, the PVAPB HGE presents better temperature stability than traditional liquid aqueous electrolytes in symmetric AC/AC supercapacitors. Compared with liquid aqueous electrolytes (0.9 mol/L KCl and 1 mol/L Na2SO4) SCs, PVAPB HGE SCs possessed higher specific capacitance in the operating temperature range from -5 ℃ to 80 ℃. The activation energy of ionic conductivity of PVAPB HGE was calculated to be 5.81 kJ/mol, indicating its temperature-insensitivity, and stable electrochemical performance in a wide temperature range. The PVAPB HGE SCs also show good cycle performance at a temperature range from -5 ℃ to 60 ℃, which is better than those of SCs using liquid aqueous electrolytes. The excellent temperature stability of PVAPB HGE made it possible be used in the harsh temperature environment with which traditional liquid aqueous electrolyte can not meet.
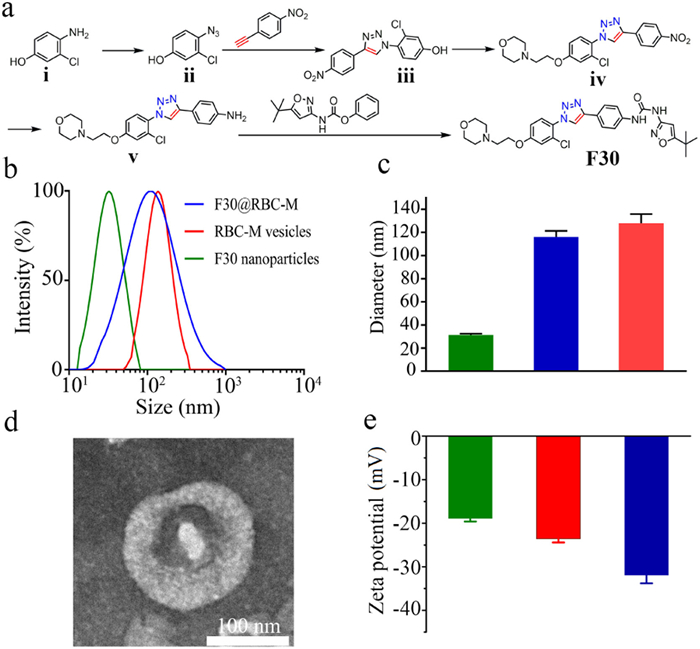
Figure 1. Synthesis of FLT3 inhibitor F30 and structural characterization of F30@RBM-M. (a) The synthesis of FLT3 inhibitor F30. (b) Size intensity curves of F30@RBC-M, RBC-M vesicles and nanoparticle cores. (c) Particle sizes of F30@RBC-M, RBC-M vesicles, nanoparticle cores. The sizes were measured using DLS. (d) TEM image of F30@RBC-M. The white solid core is F30 nanoparticles, the spherical shell is the RBC-M vesicle, the samples were negatively stained with uranyl acetate. (e) Zeta potential of F30@RBC-M, RBC-M vesicles and nanoparticle cores. Bars represent means ± SD (n = 3).
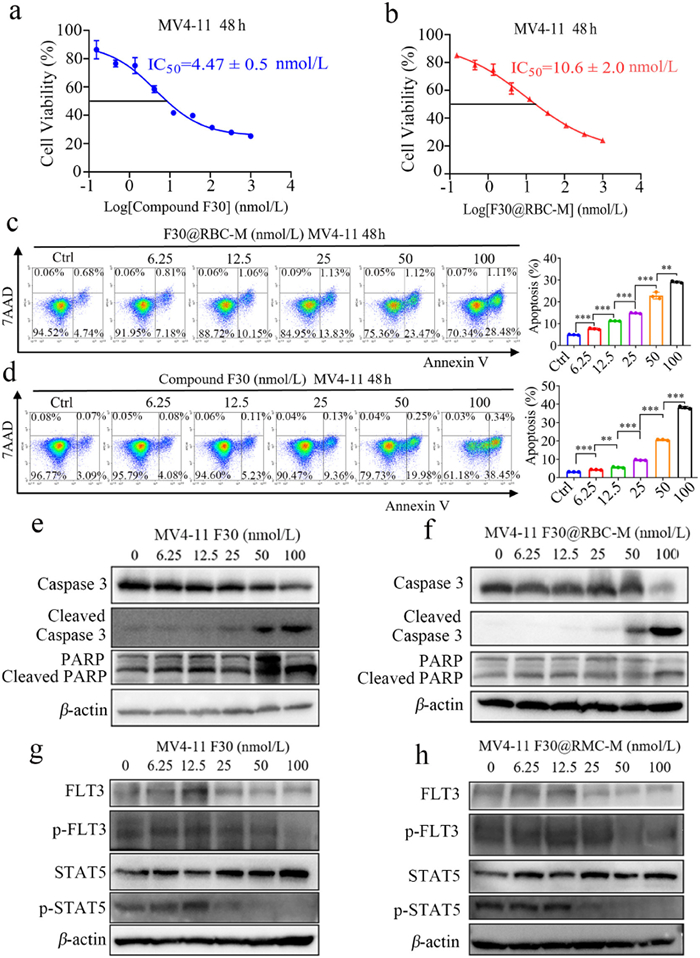
Figure 2. Anti-AML cell activity of compound F30 and F30@RBC-M. (a, b) The anti-proliferation activity of test compounds against MV4-11 cells. (c, d) Flow cytometry analysis of compound F30 or F30@RBC-M induced MV4-11 cells apoptosis. The cells were incubated with compound F30 or F30@RBC-M at indicated concentrations for 48 h, and the assessment was conducted following standard protocols. (e, f) Dose-dependent manner of compound F30 and F30@RBC-M induced apoptosis of MV4-11 cells. Cells were exposed to compound F30 or F30@RBC-M at indicated concentrations for 48 h. (g, h) Western blot analysis of the effects of compound F30 and F30@RBC-M on FLT3, STAT5 and p-STAT5 in MV4-11 cells. Data are presented as mean ± SEM (n = 3). *P < 0.05, **P < 0.01, ***P < 0.001.
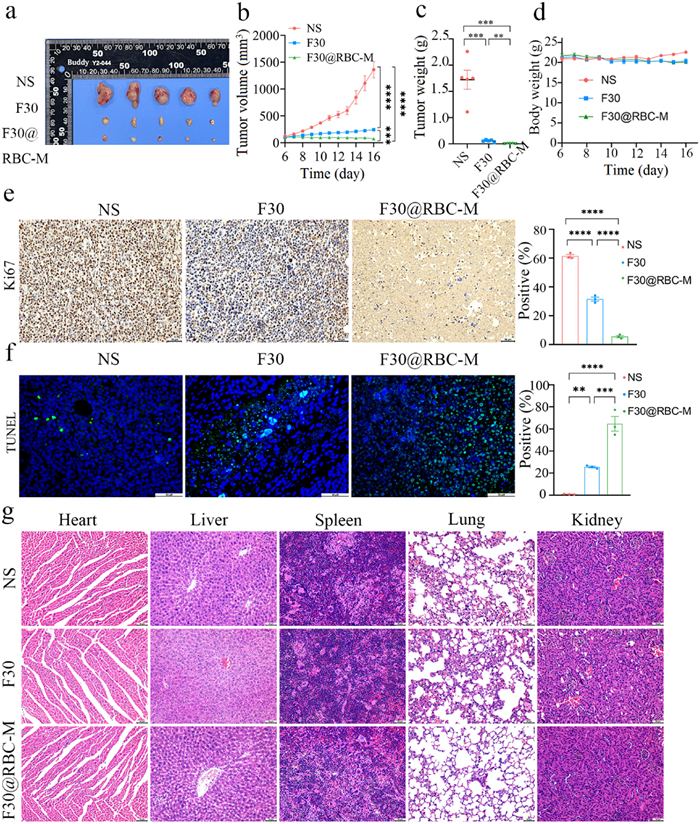
Figure 3. In vivo anti-AML efficacy of F30@RBC-M in the MV4-11 xenograft model. (a, b) Tumor volume. Mice were administrated with normal saline (NS), F30 free drug or F30@RBC-M at the dosage of 40 mg kg−1 day−1. Tumor volume was monitored every day. (c) Tumor weight. (d) Mice body weight. (e) Ki67 staining of tumor tissues. (f) Terminal deoxynucleotidyl transferase mediated dUTP nick-end labeling (TUNEL) staining of tumor tissues. (g) Hematoxylin and eosin staining of major organs after treatment with normal saline, F30 free drug or F30@RBC-M. Data are presented as mean ± SEM (n = 3). **P < 0.01, ***P < 0.001, ****P < 0.0001. Scale bar: 50 µm. NS, normal saline.
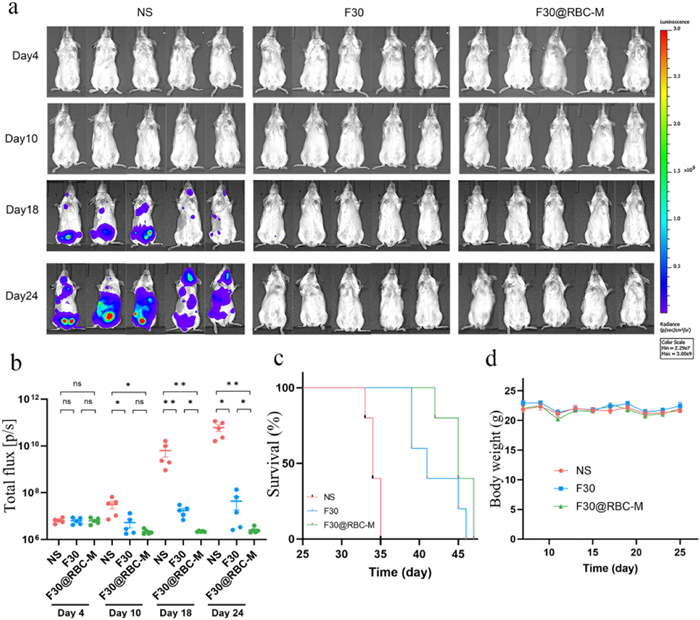
Figure 4. Antileukemic effects of F30@RBC-M in a MV4-11 luciferase-transduced transplanted mouse model. (a) Fluorescence images of all groups on day 4, 10, 18, and 24. (b) Quantification of the bioluminescent signal intensity. (c) Survival of mice. (d) Changes of mice body weight after treatment. Data are presented as mean ± SEM (n = 5). *P < 0.05, **P < 0.01. ns, not significant.

 Login In


 下载:
下载:

 DownLoad: