Login In
The exquisite integration of ESIPT, PET and AIE for constructing fluorescent probe for Hg(Ⅱ) detection and poisoning
-
* Corresponding author.
E-mail address: wbzeng@hotmail.com (W. Zeng).
Figures(6)
Citation:
Xiang Cheng, Shuai Huang, Qian Lei, Fei Chen, Fan Zheng, Shibo Zhong, Xueyan Huang, Bin Feng, Xueping Feng, Wenbin Zeng. The exquisite integration of ESIPT, PET and AIE for constructing fluorescent probe for Hg(Ⅱ) detection and poisoning[J]. Chinese Chemical Letters,
;2022, 33(4): 1861-1864.
doi:
10.1016/j.cclet.2021.10.024

Figures(6)


The cellular response to the complex extracellular microenvironment is highly dynamic in time. It consists of multiple intracellular and intercellular dynamic signals, including gene regulatory networks, cell signaling networks, protein interactions, cytokine concentration gradients released from neighboring cells, biochemical responses in the extracellular matrix, and cell-to-cell interactions [1-3]. Such sophisticated and complex temporal dynamic signals are challenging to study using conventional static biological analysis methods. With the advent of many new technologies, it is scientifically important to simulate or reconstruct the complex and dynamic extracellular microenvironment and analyze the intra- or intercellular signaling to deeper understand the regulatory mechanisms of life at the cellular level [4].
The intracellular G protein-coupled receptors (GPCRs) mediated a series of key physiological events in vivo, through which various hormonal signals, as well as extracellular environmental stimulation, could be responded [5]. Currently, with the flourishing development of structural biology, the three-dimensional (3D) fine structure of many GPCRs had been resolved by taking ultra-high resolution 3D photographs of GPCRs molecules with X-ray. However, their 3D structures were usually in a certain static state and their resolved environment was not the surface of living cells. Since the conformation of GPCRs was very unstable and "active", it was a hot and challenging issue to detect their dynamic conformational changes and the dynamics of their mediated downstream signaling molecules, such as the second messenger signal-calcium signal [6-10]. How can cells recognize and sense dynamic extracellular signals (changes in the concentration and frequency of signal molecules) with high fidelity through GPCRs in the complex and dynamic extracellular environment? How do cells process and decode extracellular signals? Based on the resolved 3D structure of GPCRs, a profitable way to study the signaling pathway of GPCRs was combining the dynamic administration of multiple drug (ligand) stimuli outside living cells with optical imaging and molecular biology labeling tools to observe the conformational dynamics and dynamic response of intracellular signaling molecules.
High resolution of dynamic signaling pathways in GPCRs often requires two key technologies: high-resolution signal detection and highly controlled perturbation of the extracellular environment. The former had been developed rapidly [11-15], but the latter still faced many challenges. Traditional methods for extracellular environment manipulation were mainly based on microperfusion [16], but the drawback was the inflexible solution switching. Microfluidic chip-based cell stimulation had many advantages, such as fast solution switching time (as fast as sub-microsecond level), high solution controllability, and high temporal resolution, making it one of the most favorable platforms for studying intracellular dynamic signals [17-23]. In 2001, Takayama et al. successfully implemented localized cellular drug delivery using microfluidic laminar flow technology. For the first time, they explored the relationship between intracellular mitochondrial movement and cytoskeleton, extending the microfluidic cell biology research to the subcellular domain [24]. The method was simple, controllable, and non-destructive to cells and was being adapted and improved by other scientists rapidly, becoming the most favorable method for microfluidic cell biology research. Since cells were in a complex dynamic environment under physiological conditions, cell biology research had evolved from static stimulation to dynamic stimulation, which facilitated realistic simulation of the physiological environment in vivo. It was able to obtain data that was not available from static stimulation as well [25-29]. Sabounchi et al. first introduced the traditional rapid perfusion technique to microfluidic chips using negative pressure in the side channels to immobilize cells. The drug flowed over the immobilized cells for rapid stimulation from the upstream channels [30]. The use of negative pressure, however, might affect the cells. Hersen et al. then used a pneumatic pressure-driven fluid to generate a square wave signal for rapid switching to study the effect of dynamic osmolarity square wave stimulation on yeast cells [31]. Still, the stability of the rapid switching process needed to be improved. King et al. proposed a signal generator method based on laminar flow-encoded switching (FES), which was used to study the effect of tumor necrosis factor α (TNF-α) on NF-κB transcriptional activation and apoptosis at different times in a high-throughput and efficient manner [32]. Chingozha et al. gave dynamic external stimulation based on captured single-cell arrays to detect changes in calcium signals in T cells with high throughput and more homogeneous stimulation [33, 34]. In addition, various capture structures on the chip were developed for investigating single cells, particularly single suspension cells [35-41]. Each of these microchip technologies had its advantages, but achieving multiplexed cellular dynamic drug stimulation and thus studying intracellular dynamic signaling response remains a significant challenge.
Recently, our group proposed a precise and sensitive hydrodynamic gating technique and a number of optimized versions that could generate richly varied chemical stimulation patterns to obtain intracellular signals, while ensuring high temporal and spatial resolution and high accuracy [42-45]. To probe single-cell dynamic signals, a new concentration gradient generator with a multi-channel synchronized hydrodynamic gating technique was developed to generate a series of chemical waveforms with different amplitudes and frequencies, and enabled multi-set of experiments in parallel [46]. This paper proposed a new method to probe single-cell dynamic signals based on a microfluidic chip with a time-coded multi-concentration chemical waveform generator. The system had four independent sample inlets, which could encode four different concentrations of drugs at different frequencies and in different time sequences to study the dynamic response of cells. By adjusting the order of encoding, the platform enables both continuous and pulsed waveform stimulation. Cell trap array set up in the stimulation channel allowed for rapid capture of suspension single cells, simplified experimental preparation, and increased ease of operation.
The system device consisted of five independent E/P transducers (T-2001, Bellofram, USA) as multi-channel pressure control module, a LabVIEW program as signal control module, and a microfluidic chip (Fig. 1a). The E/P transducers were output to each of the four sample inlets and two buffer inlets of the microfluidic chip with 0.1% accuracy, thus controlling the fluid switching within the microchip. The dynamic chemical signals with different frequencies were regulated with the outputs of a voltage output module (NI-9264, National Instruments, USA) which was controlled by a program in LabVIEW (National Instruments, USA).
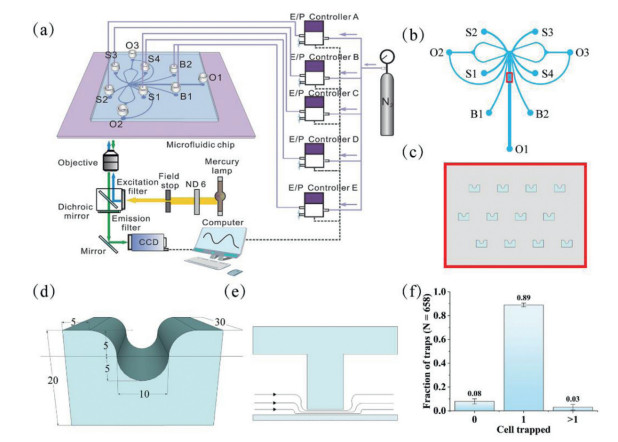
A polydimethylsiloxane (PDMS)-glass hybrid microchip with a cell trap array was designed. The main channel of the chip was shown in Fig. 1b, and it was axisymmetric. The reservoirs S1–S4, B1, B2, O1–O3 corresponded to sample inlet 1, sample inlets 2–4, buffer inlets 1, 2, outlets 1–3. The channel height was approximately 30 µm. The widths of the corresponding channels were labeled in Fig. S1 (Supporting information), while the widths of all other channels were 200 µm except for the labeled channels and their symmetric channels. Fig. 1c showed the cell trap array in the channel, which was marked with red box in Fig. 2a. Its detailed dimensions were shown in Fig. 1d, there was a 3 µm gap between the capture structure and the bottom glass slide. The working principle of the trap was: when the cell was not captured, the solution could pass through the gap; once a cell was captured, the gap will be blocked by the cell, and the solution would bypass the capture structure on both sides, which ensured that there was one and only one captured cell per capture structure (Fig. 1e) [47]. To obtain the cell trap array, the chip was fabricated using an overlay technique. Correspondingly, two masks were used, as shown in Fig. S2 (Supporting information). The first mask (Fig. S2a) could produce the gap between the capture structure and the slide, and the second mask (Fig. S2b) was the main channel of the microchip. The key to accomplishing a more ideal overlay operation was that the graphics of the two exposures should overlap as much as possible, which required a more skillful operation technique.
Before sample injection, the chip channel needed to be treated so that the cells could enter smoothly. First, the fabricated PDMS-glass hybrid microchip was placed in a plasma cleaner with the voltage set to 800 V for 2 min, which increased the hydrophilicity of the inner surface of the microchannel. After cleaning, a 75% ethanol solution was quickly added to all reservoirs. The ethanol solution played a role in sterilization and maintained the hydrophilicity inside the channels. Subsequently, the microchip was placed in the ultra-clean bench and irradiated with ultraviolet light for 30 min. Then, the chips would be further cleaned in the ultra-clean bench with ethanol solution and cell culture medium under negative pressure with a syringe. This step was repeated three times.
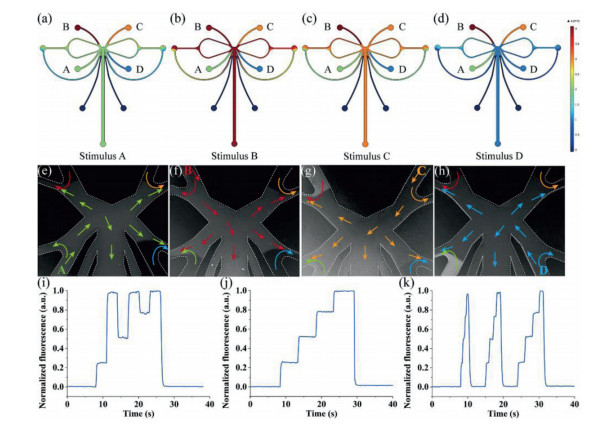
Numerical simulation was used to make the chip design optimized, by visualizing the concentration distribution at different stimulation states. Two-dimensional numerical simulations based on the finite element method (FEM) were performed on the modeling software COMSOL Multiphysics (COMSOL AB, Sweden). The modeled fluids were set up as a laminar flow model and a dilute matter transfer model [46]. Typical results of the concentration distribution of the FEM simulation were shown in Fig. 2. The four stock liquids A–D were different concentrations of fluorescein solution, and the concentrations were set to 1–4. Figs. 2a–d showed the concentration distributions of solutions A–D in the stimulation phase, respectively.
To test the stability, reproducibility, and limiting temporal resolution of the system, fluorescein solutions were used to evaluate the system. 150 µL fluorescein solutions with concentrations of 0, 10, 20 and 30 µmol/L were introduced to the reservoirs S1–S4 of the microfluidic chip, respectively. For the convenience of description, these four solutions were named solutions A–D. Equal volumes of Hank's balanced salt solution (HBSS) were introduced to reservoir B1 and B2. The evaluation experiments were performed with an inverted fluorescence microscope, and approximately 300 µm downstream of the gating structure was selected as an observation area for waveform image acquisition. The actual results of stimulation A–D were shown in Figs. 2e–h in turn, which was corresponding to Figs. 2a–d. The flow direction of the four solutions was indicated by the green, red, orange, and blue arrows, respectively. Since switching the pressure of each inlet allowed precise control of the frequency, the system could generate a variety of time-coded waveforms at various frequencies and concentrations. Some of the typical waveforms were shown in Figs. 2i and j: (i) A constant injection time of 3 s for each solution, and the time code was solution ADBDCD; (j) a constant injection time of 5 s for each solution, and the time code was ABCD. More time codes for different frequencies, concentrations, and even different drugs could be generated on demand. To further understand the limiting temporal resolution of the system, a series of coded waveforms was generated with short to long periods (Fig. 2k). The stimulation periods of individual stimuli for the three waveforms were 0.5, 1 and 2 s from left to right. Obviously, no plateau appeared when the stimulation period was 0.5 s, which means that stable stimulation could not be achieved at this frequency. When the period was 1 and 2 s, a stable stimulation could be formed. Therefore, it could be determined that the limiting temporal resolution of the platform was 1 Hz.
To test the single cell capture effect of the system, HeLa cell suspension at a concentration of about 1 × 10⁶ cells/mL was fed to evaluate the system. 150 µL of cell suspension was introduced to reservoir B1 and B2 of the chip, and the same volumes of HBSS were added to reservoirs S1–S4. A small air pressure (about 0.1 kPa) was applied at reservoirs B1 and B2, and the cell suspension would rapidly flow into the cell trap array channel and be captured. The capture process could be completed in approximately 2, 3 min. Typical results of capturing single cells were shown in Fig. 1f. A statistical analysis of the cell capture of 327 traps showed that 3% of the capture structures captured no cell, 89% captured single cells, and 8% captured two or more cells. In other words, about 97% of the traps captured cells, and the percentage of which captured single cells was as high as 92%, showing the excellent ability to capture single cells.
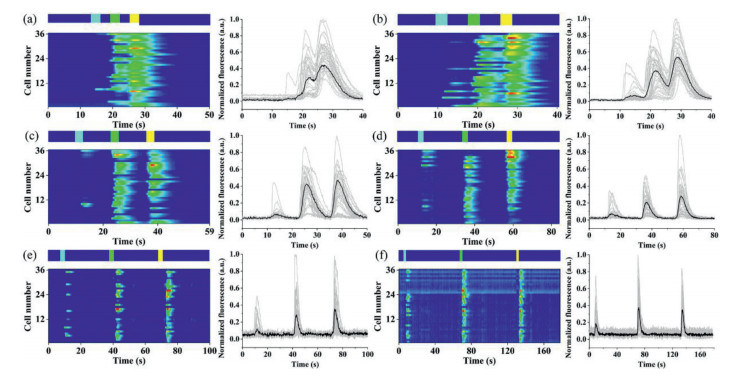
The dynamic responses of HeLa single-cell arrays were first studied by pulsed stimulation of the same time code and different frequencies. Histamine (HA) was the chemical stimulus. Sample inlets S1–S4 were added with 150 µL of HA solutions at concentrations of 10, 20, 30 and 0 µmol/L, respectively, denoted as solutions A–D for the convenience of description. Buffer inlets B1 and B2 were both added with 150 µL of HBSS. In the buffer state, the inlets B1 and B2 were under high pressure, making the buffer solution fill the cell array channel. When the stimulation started, the S1 inlet pressure was increased momentarily and the inlets S2–S4, B1 and B2 pressures were decreased, making the HA solution fill the cell array channel. The concentration of cytoplasmic Ca2+ was recorded by charge-coupled device (CCD) camera real-time imaging with Fluo-4/AM. The time code used for the experiments was ADBDCD. Heat maps (left) and corresponding time plots (right) of the response of single cells to different frequencies were shown in Fig. 3, and 36 single cells were selected for tracking in each plot. In the single stimulation from Figs. 3a–f, the injection time of solution ABC was 3 s and kept constant; the injection time of solution D (the buffer time) gradually increased, followed by 3, 5, 10, 20, 30 and 60 s. When the buffer time was short (3 s), the responses of the three stimuli were continuous, and no independent response was generated. Starting from 5 s, an independent signal peak appeared for each stimulus response. Since the concentration of the three stimuli was sequentially increasing, the number of responding cells was also increasing.
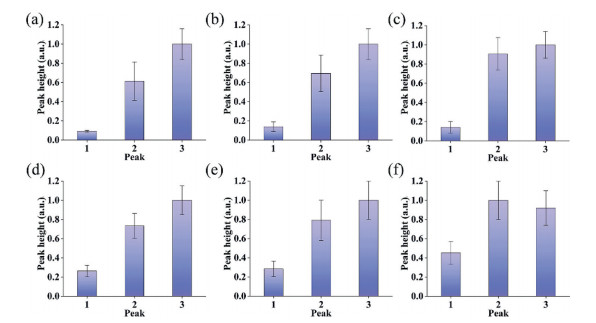
Analysis of the mean intensities of the three responses in each plot was shown in Fig. 4, which revealed that the mean response of the cells increased with increasing stimulant concentration, regardless of the buffer time. However, the response intensities of 20 µmol/L and 30 µmol/L HA became increasingly similar as the buffering time increased (Figs. 4a–f). As shown in Figs. 4c–f, the response intensity of the cells was significantly enhanced when the stimulation concentration was increased from 10 µmol/L to 20 µmol/L. However, when the concentration was increased from 20 µmol/L to 30 µmol/L, there was only a slight increase in response intensity, and responses of 20 µmol/L were even greater than 30 µmol/L. It also confirmed that the optimal concentration (25 µmol/L) of HA did exist, which was reported in the previous study of our group.
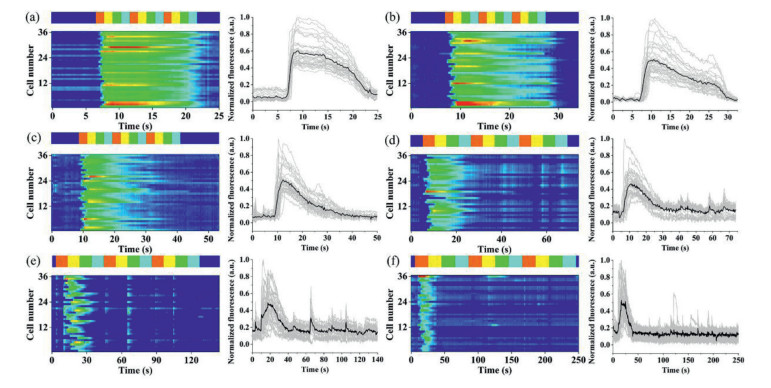
The platform could generate not only pulse waveforms of different frequencies with the same timing code, but also continuous waveforms. In the experiment, sample inlets S1–S4 were added with 150 µL of HA solutions at concentrations of 10, 20, 30 and 40 µmol/L, respectively, denoted as solutions A–D for ease of description. Buffer inlets B1 and B2 were both added with 150 µL of HBSS. In the buffer phase, the inlets B1 and B2 were under high pressure, which made the buffer solution fill the cell array channel. When switching to the stimulation phase, the pressure of S1 inlet was increased momentarily, and the pressures of inlet S2–S4, B1 and B2 were decreased, making the HA solution fill the cell array channels. The experiments were performed using a time code of solution ABCD and repeated three times consecutively. The heat maps (left) and time plots (right) of the single-cell response to different frequencies were shown in Fig. 5, with 36 single cells selected for tracking in each graph as well. The single stimulation periods from Figs. 5a to f gradually increased, in the order of 1–3, 5, 10 and 20 s. It could be seen that the cell response tended to enhance and then weaken during the stimulation process, regardless of the stimulation period. When the stimulation time was short (Fig. 5a), many cells responded to each stimulation. As the stimulation period increased (Figs. 5b and c), the number of cells responding in the late stimulation period gradually decreases. However, when the stimulation cycle grew further (Figs. 5d–f), the cells again appeared to respond intermittently. The possible reason was that, at the beginning, when the cellular stimulus did not reach the optimal concentration, the cellular response increased with the increase of the stimulus concentration. As the stimulation continues, the cells became desensitized and the response gradually decreases. When the period was further increased, the cell state was slightly restored and a weak response appeared again.
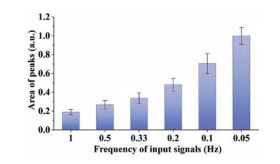
The peak area of the average response throughout the stimulation process was analyzed in Fig. 6, and it was found that the peak area of the average cellular response tended to increase with the increase of the stimulation period. In other words, although the cellular response appeared to be very weak in the late phase of long-duration stimulation from the single-cell plots, it was still evident that more cellular calcium responses appeared in the long-duration stimulation.
In summary, we proposed a microfluidic platform with a time-coded multi-concentration generator combined with a single-cell trap array, which enabled the study of dynamic response in a single cell by generating chemical waveforms of multiple concentrations with different time codes and various frequencies simultaneously. To verify the stability, reproducibility, and applicability of the platform, numerical simulations, flow visualization experiments, and limiting time resolution evaluations were performed. The platform had a maximum frequency of 1 Hz and allowed stimulation of one cell at multiple frequencies. HeLa cells were chosen to be the study model, and pulsed chemical waveform and continuous chemical waveform at different frequencies with different time codes were successfully implemented. As a proof of concept, only two coding modes for four concentrations of stimuli were shown here. However, the platform was much more than that, and could also perform multiple modes of coding for different kinds of stimuli according to the experiment's needs. We believe that this platform will provide new methods and ideas for probing dynamic cell signaling and elucidating cell signaling pathways.
The authors declare no competing financial interest.
The authors gratefully acknowledge the financial support from the National Natural Science Foundation of China (Nos. 22074047, 21775049 and 31700746), the Hubei Provincial Natural Science Foundation of China (No. 2020CFB578) and the Fundamental Research Funds for Central Universities, HUST (Nos. 2020kfyXJJS034 and 2021GCRC056).
Supplementary material associated with this article can be found, in the online version, at doi:10.1016/j.cclet.2021.09.080.
N. Ferreira-Rodriguez, A.J. Castro, B.N. Tweedy, et al., J. Environ. Manage. 282(2021) 111528-111535.
doi: 10.1016/j.jenvman.2020.111528
N.E. Selin, Science 360(2018) 607-609.
doi: 10.1126/science.aar8256
L.T. Budnik, L. Casteleyn, Sci. Total. Environ. 654(2019) 720-734.
doi: 10.1016/j.scitotenv.2018.10.408
L. Yang, Y. Zhang, F. Wang, et al., Chemosphere 245(2020) 125586-125620.
doi: 10.1016/j.chemosphere.2019.125586
Q. Wang, D. Kim, D.D. Dionysiou, et al., Environ. Pollut. 131(2004) 323-336.
doi: 10.1016/j.envpol.2004.01.010
Q. Fu, X. Fan, J. Sun, et al., Small 16(2020) e2000072.
doi: 10.1002/smll.202000072
O.P. Ajsuvakova, A.A. Tinkov, M. Aschner, et al., Coord. Chem. Rev. 417(2020) 213343-213359.
doi: 10.1016/j.ccr.2020.213343
H.H. Harris, I.J. Pickering, G.N. George, Science 301(2003) 1203.
doi: 10.1126/science.1085941
F.Y. Yan, D.L. Cao, N. Yang, et al., Sens. Actuators B: Chem. 162(2012) 313-320.
doi: 10.1016/j.snb.2011.12.086
Z. Khoshbin, M.R. Housaindokht, A. Verdian, et al., Biosens. Bioelectron. 116(2018) 130-147.
doi: 10.1016/j.bios.2018.05.051
P. Mahato, A. Ghosh, S. Saha, et al., Inorg. Chem. 49(2010) 11485-11492.
doi: 10.1021/ic1014797
L. Zhao, Z. Zhang, Y. Liu, et al., J. Hazard. Mater. 385(2020) 121556-121564.
doi: 10.1016/j.jhazmat.2019.121556
Y. Jiang, H. Li, R. Chen, et al., Spectrochim. Acta A: Mol. Biomol. Spectrosc. 251(2021) 119438-119446.
doi: 10.1016/j.saa.2021.119438
Y. Wang, L. Zhang, X. Han, et al., Chem. Eng. J. 406(2021) 127166-127180.
doi: 10.1016/j.cej.2020.127166
H. Erxleben, J. Ruzicka, Anal. Chem. 77(2005) 5124-5128.
doi: 10.1021/ac058007s
L. Wu, A.C. Sedgwick, X. Sun, et al., Acc. Chem. Res. 52(2019) 2582-2597.
doi: 10.1021/acs.accounts.9b00302
H. Ren, F. Huo, Y. Huang, et al., Dyes Pigm. 181(2020) 108567-108573.
doi: 10.1016/j.dyepig.2020.108567
H. Ren, F. Huo, X. Wu, et al., Chem. Commun. (Camb) 57(2021) 655-658.
doi: 10.1039/D0CC07398A
Y. Wen, F. Huo, C. Yin, Chin. Chem. Lett. 30(2019) 1834-1842.
doi: 10.1016/j.cclet.2019.07.006
H. Ren, F. Huo, Y. Zhang, et al., Sens. Actuators B: Chem. 319(2020) 128248-128255.
doi: 10.1016/j.snb.2020.128248
B. Zhang, H. Zhang, M. Zhong, et al., Chin. Chem. Lett. 31(2020) 133-135.
doi: 10.1016/j.cclet.2019.05.061
B. Feng, Y. Zhu, J. Wu, et al., Chin. Chem. Lett. 32(2021) 3057-3060.
doi: 10.1016/j.cclet.2021.03.074
X. Yang, W. Liu, J. Tang, et al., Chem. Commun. (Camb) 54(2018) 11387-11390.
doi: 10.1039/C8CC05418E
H. Zhang, P. Xu, X. Zhang, et al., Chin. Chem. Lett. 31(2020) 1083-1086.
doi: 10.1016/j.cclet.2019.10.005
A. Bi, M. Liu, S. Huang, et al., Chem. Commun. (Camb) 57(2021) 3496-3499.
doi: 10.1039/D1CC00429H
L. Huang, X. Cao, T. Gao, et al., Talanta 225(2021) 121950-121956.
doi: 10.1016/j.talanta.2020.121950
S. Yoon, A.E. Albers, A.P. Wong, et al., J. Am. Chem. Soc. 127(2005) 16030-16031.
doi: 10.1021/ja0557987
B. Zhou, S. Qin, B. Chen, et al., Tetrahedron Lett. 59(2018) 4359-4363.
doi: 10.1016/j.tetlet.2018.10.068
S. Erdemir, O. Kocyigit, Dyes Pigm. 145(2017) 72-79.
doi: 10.1016/j.dyepig.2017.05.053
S. Gharami, K. Aich, P. Ghosh, et al., Dalton Trans. 49(2020) 187-195.
doi: 10.1039/C9DT04245H
S. Das, A. Sarkar, A. Rakshit, et al., Inorg. Chem. 57(2018) 5273-5281.
doi: 10.1021/acs.inorgchem.8b00310
S. Huang, T. Gao, A. Bi, et al., Dyes Pigm. 172(2020) 107830-107838.
doi: 10.1016/j.dyepig.2019.107830
T. Gao, X. Huang, S. Huang, et al., J. Agric. Food Chem. 67(2019) 2377-2383.
doi: 10.1021/acs.jafc.8b06895
Y. Tu, Y. Yu, D. Xiao, et al., Adv. Sci. 7(2020) 2001845.
doi: 10.1002/advs.202001845
T. Lu, F.W. Chen, J. Comput. Chem. 33(2012) 580-592.
doi: 10.1002/jcc.22885
G.H. Chen, W.Y. Chen, Y.C. Yen, et al., Anal. Chem. 86(2014) 6843-6849.
C.C. Bridges, L. Joshee, R.K. Zalups, Toxicol. Sci. 105(2008) 211-220.
doi: 10.1093/toxsci/kfn107

Kun Zhang , Xin-Yue Lou , Yan Wang , Weiwei Huan , Ying-Wei Yang . Emission enhancement induced by the supramolecular assembly of leggero pillar[5]arenes for the detection and separation of silver ions. Chinese Chemical Letters, 2025, 36(6): 110464-. doi: 10.1016/j.cclet.2024.110464
Kuan Deng , Fei Yang , Zhi-Qi Cheng , Bi-Wen Ren , Hua Liu , Jiao Chen , Meng-Yao She , Le Yu , Xiao-Gang Liu , Hai-Tao Feng , Jian-Li Li . Construction of wavelength-tunable DSE quinoline salt derivatives by regulating the hybridization form of the nitrogen atom and intramolecular torsion angle. Chinese Chemical Letters, 2024, 35(10): 109464-. doi: 10.1016/j.cclet.2023.109464
Shuo Li , Qianfa Liu , Lijun Mao , Xin Zhang , Chunju Li , Da Ma . Benzothiadiazole-based water-soluble macrocycle: Synthesis, aggregation-induced emission and selective detection of spermine. Chinese Chemical Letters, 2024, 35(11): 109791-. doi: 10.1016/j.cclet.2024.109791
Tong-Tong Zhou , Guan-Yu Ding , Xue Li , Li-Li Wen , Xiao-Xu Pang , Ying-Chen Duan , Ju-Yang He , Guo-Gang Shan , Zhong-Min Su . Design of near-infrared aggregation-induced emission photosensitizers by π-bridge engineering for boosting theranostic efficacy. Chinese Chemical Letters, 2025, 36(6): 110341-. doi: 10.1016/j.cclet.2024.110341
Jun-Jie Fang , Zheng Liu , Yun-Peng Xie , Xing Lu . Superatomic Ag58 nanoclusters incorporating a [MS4@Ag12]2+ (M = Mo or W) kernel show aggregation-induced emission. Chinese Chemical Letters, 2024, 35(10): 109345-. doi: 10.1016/j.cclet.2023.109345
Yunli Xu , Xuwen Da , Lei Wang , Yatong Peng , Wanpeng Zhou , Xiulian Liu , Yao Wu , Wentao Wang , Xuesong Wang , Qianxiong Zhou . Ru(Ⅱ)-based aggregation-induced emission (AIE) agents with efficient 1O2 generation, photo-catalytic NADH oxidation and anticancer activity. Chinese Chemical Letters, 2025, 36(5): 110168-. doi: 10.1016/j.cclet.2024.110168
Min Liu , Bin Feng , Feiyi Chu , Duoyang Fan , Fan Zheng , Fei Chen , Wenbin Zeng . An ESIPT-boosted NIR nanoprobe for ratiometric sensing of carbon monoxide via activatable aggregation-induced dual-color fluorescence. Chinese Chemical Letters, 2025, 36(5): 110043-. doi: 10.1016/j.cclet.2024.110043
Yi Liu , Peng Lei , Yang Feng , Shiwei Fu , Xiaoqing Liu , Siqi Zhang , Bin Tu , Chen Chen , Yifan Li , Lei Wang , Qing-Dao Zeng . Topologically engineering of π-conjugated macrocycles: Tunable emission and photochemical reaction toward multi-cyclic polymers. Chinese Chemical Letters, 2024, 35(10): 109571-. doi: 10.1016/j.cclet.2024.109571
Chaochao Jin , Kai Li , Jiongpei Zhang , Zhihua Wang , Jiajing Tan . N,O-Bidentated difluoroboron complexes based on pyridine-ester enolates: Facile synthesis, post-complexation modification, optical properties, and applications. Chinese Chemical Letters, 2024, 35(9): 109532-. doi: 10.1016/j.cclet.2024.109532
You Zhou , Li-Sheng Wang , Shuang-Gui Lei , Bo-Cheng Tang , Zhi-Cheng Yu , Xing Li , Yan-Dong Wu , Kai-Lu Zheng , An-Xin Wu . I2-DMSO mediated tetra-functionalization of enaminones for the construction of novel furo[2′,3′:4,5]pyrimido[1,2-b]indazole skeletons via in situ capture of ketenimine cations. Chinese Chemical Letters, 2025, 36(1): 109799-. doi: 10.1016/j.cclet.2024.109799
Haibo Wan , Zhengzhong Lv , Jicai Jiang , Xuefeng Cheng , Qingfeng Xu , Haibin Shi , Jianmei Lu . Multidimensional detection of roxarsone via AIE-based sulfates. Chinese Chemical Letters, 2025, 36(3): 110023-. doi: 10.1016/j.cclet.2024.110023
Xuejian Xing , Pan Zhu , E Pang , Shaojing Zhao , Yu Tang , Zheyu Hu , Quchang Ouyang , Minhuan Lan . D-A-D-structured boron-dipyrromethene with aggregation-induced enhanced phototherapeutic efficiency for near-infrared fluorescent and photoacoustic imaging-guided synergistic photodynamic and photothermal cancer therapy. Chinese Chemical Letters, 2024, 35(10): 109452-. doi: 10.1016/j.cclet.2023.109452
Qinghong Zhang , Qiao Zhao , Xiaodi Wu , Li Wang , Kairui Shen , Yuchen Hua , Cheng Gao , Yu Zhang , Mei Peng , Kai Zhao . Visible-light-induced ring-opening cross-coupling of cycloalcohols with vinylazaarenes and enones via β-C-C scission enabled by proton-coupled electron transfer. Chinese Chemical Letters, 2025, 36(2): 110167-. doi: 10.1016/j.cclet.2024.110167
Yi Liu , Zhe-Hao Wang , Guan-Hua Xue , Lin Chen , Li-Hua Yuan , Yi-Wen Li , Da-Gang Yu , Jian-Heng Ye . Photocatalytic dicarboxylation of strained C–C bonds with CO2 via consecutive visible-light-induced electron transfer. Chinese Chemical Letters, 2024, 35(6): 109138-. doi: 10.1016/j.cclet.2023.109138
Xiang Li , Beibei Zhang , Zhixiang Wang , Xiangyu Chen . Organocatalyzed iodine-mediated reversible-deactivation radical polymerization via photoinduced charge transfer complex catalysis. Chinese Chemical Letters, 2025, 36(6): 110383-. doi: 10.1016/j.cclet.2024.110383
Hui Liu , Xiangyang Tang , Zhuang Cheng , Yin Hu , Yan Yan , Yangze Xu , Zihan Su , Futong Liu , Ping Lu . Constructing multifunctional deep-blue emitters with weak charge transfer excited state for high-performance non-doped blue OLEDs and single-emissive-layer hybrid white OLEDs. Chinese Chemical Letters, 2024, 35(10): 109809-. doi: 10.1016/j.cclet.2024.109809
Xudong Zhao , Yuxuan Wang , Xinxin Gao , Xinli Gao , Meihua Wang , Hongliang Huang , Baosheng Liu . Anchoring thiol-rich traps in 1D channel wall of metal-organic framework for efficient removal of mercury ions. Chinese Chemical Letters, 2025, 36(2): 109901-. doi: 10.1016/j.cclet.2024.109901
Chunxiu Yu , Zelin Wu , Hongle Shi , Lingyun Gu , Kexin Chen , Chuan-Shu He , Yang Liu , Heng Zhang , Peng Zhou , Zhaokun Xiong , Bo Lai . Insights into the electron transfer mechanisms of peroxydisulfate activation by modified metal-free acetylene black for degradation of sulfisoxazole. Chinese Chemical Letters, 2024, 35(8): 109334-. doi: 10.1016/j.cclet.2023.109334
Yiqian Jiang , Zihan Yang , Xiuru Bi , Nan Yao , Peiqing Zhao , Xu Meng . Mediated electron transfer process in α-MnO2 catalyzed Fenton-like reaction for oxytetracycline degradation. Chinese Chemical Letters, 2024, 35(8): 109331-. doi: 10.1016/j.cclet.2023.109331
Rui Gao , Ying Zhou , Yifan Hu , Siyuan Chen , Shouhong Xu , Qianfu Luo , Wenqing Zhang . Design, Synthesis and Performance Experiment of Novel Photoswitchable Hybrid Tetraarylethenes. University Chemistry, 2024, 39(5): 125-133. doi: 10.3866/PKU.DXHX202310050
 DownLoad:
 DownLoad: