Citation:
Yanyan Wang, Dongxiang Zhang, Kangming Xiong, Rong Shang, Xin-Dong Jiang. Near-infrared absorbing (>700 nm) aza-BODIPYs by freezing the rotation of the aryl groups[J]. Chinese Chemical Letters,
;2022, 33(1): 115-122.
doi:
10.1016/j.cclet.2021.06.083
Near-infrared absorbing (>700 nm) aza-BODIPYs by freezing the rotation of the aryl groups
Shenyang Key Laboratory of Functional Dye and Pigment, Shenyang University of Chemical Technology, Shenyang 110142, China
b.
CAS Key Laboratory of Separation Science for Analytical Chemistry, Dalian Institute of Chemical Physics, Chinese Academy of Sciences, Dalian 116023, China
c.
Department of Chemistry, Graduate School of Science, Hiroshima University, Higashi-Hiroshima 7398526, Japan
* Corresponding author. E-mail address: xdjiang@syuct.edu.cn (X.-D. Jiang). 1 These authors contributed equally to this work.
Received Date:
21 April 2021 Revised Date:
10 June 2021 Accepted Date:
28 June 2021 Available Online:
5 July 2021
The typical aza-BODIPYs in the dye family are known for bright fluorescence, excellent stability, and tunable absorption wavelengths. Hence, these dyes are attracting the increasing attention. Aza-BODIPYs having the maxima absorption in the near-infrared (NIR) region (650–900 nm) are very favorable for bioimaging in vivo due to the less photo-damage, deeper tissue penetration, and less interference from background auto-fluorescence by biomolecules in the living systems. Many strategies have been employed to modify the structures of the aza-BODIPY core to provide the NIR absorbing dyes. Among these, the most effective method is the fusion of the aromatic rings in aza-BODIPY system. This review allsidedly summarizes the recent development of ring-fused aza-BODIPY dyes (λabs > 700 nm) focusing on the design, synthesis, and potential applications in the NIR region since 2002.
Transition metal chalcogenides (TMCs) have attracted extensive scientific interest in the fields of electrochemical energy storage and conversion due to their unique chemical and physical properties [1-3]. In particular, ternary tin-based chalcogenides (SnSSe) deliver the high theoretical capacity based on the multiple ion storage mechanisms and appropriate voltage plateaus, and their layered structure with large interlayer spacing is conducive to the insertion of alkali (Li, Na, K) ion storage and alleviate volume expansion [4-6]. However, SnSSe exhibits the deficient kinetics and fast capacity decay during the discharge and charge process, owing to its unsatisfactory electronic/ionic conductivity, and serious structural degradation and volume change. Therefore, many strategies including nanostructure design, nanocomposite optimization, doping and heterojunction etc. have been designed to enhance the ion storage performance of anode materials [7-10]. Specially, various carbon substrates with different morphologies are often used to improve conductivity, reduce diffusion distance, sustain structural strain and accommodate volume expansion of electrodes.
As a kind of carbon substrates, carbon nanofibers (CNF) with one-dimensional structure, good electrical conductivity, high mechanical strength and low density, have been applied to enhance the sodium storage performance of TMCs [11,12]. The unique structure of CNF can provide high surface-volume ratios, facilitate rapid electron/ion transport and enhance the stability of electrodes. Although CNF can improve the electrochemical performance of tin-based electrodes, designing the ternary tin-based chalcogenides coupled with CNF is rarely reported, many works do not pay attention to the synergistic effects and reaction mechanism on the hybrid composites. Meanwhile, heteroatom doping has been explored to be an effective method to introduce external defect, generate rich active sites and further optimize electronic conductivity of CNF [13].
Herein, we designed and prepared the ternary tin selenium sulfide (SnS0.5Se0.5) nanoparticles coupled with N/S/Se triple-doped carbon nanofibers (NSSe-C) through a facile strategy for the first time. Combined the merits of high theoretical capacity of SnS0.5Se0.5, and high conductivity and stability of NSSe-C, SnS0.5Se0.5@NSSe-C nanofibers display the improved sodium storage performance. Moreover, the reaction mechanisms and kinetics of SnS0.5Se0.5@NSSe-C nanofibers are investigated in detail though in situ methods and theoretical calculations.
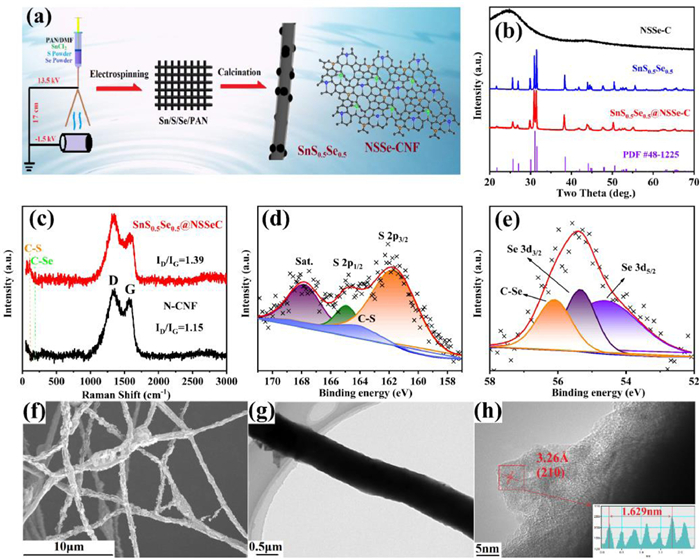
The two-step preparation of SnS0.5Se0.5@NSSe-C composite is illustrated in Fig. 1a. In the synthesis process of SnS0.5Se0.5 active material, multi-element doping of carbon fiber were achieved. Fig. 1b shows XRD patterns of SnS0.5Se0.5 prepared by solid state method, and SnS0.5Se0.5@NSSe-C and NSSe-C prepared by electrospinning and heat treatment process. The characteristic diffraction peaks of SnS0.5Se0.5 and SnS0.5Se0.5@NSSe-C are corresponding exactly to the indexed SnS0.5Se0.5 (PDF#48–1225 [14]), suggesting good crystallinity and high purity. In Fig. S1 (Supporting information), the synthesis of SnS0.5Se0.5@NSSe-C nanofibers require more sulfur and selenium powders to avoid the formation of Sn impurity, and additional sulfur and selenium powders can be doped into the N−CNF, creating more defects. The two definite peaks between 1200 cm−1 and 1700 cm−1 are observed in the Raman spectra of N−CNF and SnS0.5Se0.5@NSSe-C (Fig. 1c). The peak intensity ratio of disordered amorphous carbon (D bond) and crystalline graphic carbon (G bond) (ID/IG) value of SnS0.5Se0.5@NSSe-C (1.39) is higher than that of pure N−CNF (1.15), indicating that the S/Se doping can create more structural defects and vacancies in N−CNF, which can provide additional electrochemical action sites and help to accelerate sodium diffusion. The two peaks at 190 and 780 cm−1 for SnS0.5Se0.5@NSSe-C correspond to the C-Se and C-S bonds, respectively, which suggesting the existence of S/Se doping into the N−CNF [15,16]. Fig. S2 (Supporting information) shows the TGA/DSC curves of the SnS0.5Se0.5@NSSe-C and two exothermic peaks at 123 and 512 ℃ are observed, which are related to the evaporation of physically adsorbed water and the oxidation of SnS0.5Se0.5@NSSe-C, respectively. Based the residual mass, the carbon content in SnS0.5Se0.5@NSSe-C can be calculated to 45.63%. The XPS characteristic peaks corresponding Sn, S, Se and N elements are observed in Fig. S3 (Supporting information) and the N element is mainly produced by carbonization of polypropylene. As shown in Fig. S4 (Supporting information), the three fitted peaks located at 398.4, 399.8 and 400.5 eV correspond to pyridinic-N, pyrrolic-N and graphitic-N, respectively [17,18]. The high-resolution C 1s spectrum in Fig. S5 (Supporting information) can be fitted and separated into five peaks at 284.5, 284.9, 285.7, 286.5 and 288.6 eV, attributing to C−C/C=C, C−O, C−N, C-S/Se and O−C=O bonds, respectively [19]. The C-S/Se bond can prove the partial substitution of carbon with S and Se elements, increasing the disorder degree of graphitization. The two peaks at 161.6 and 164.9 eV in Fig 1d correspond to S 2p3/2 and S 2p1/2, respectively, and the other peaks at 164.1 and 167.8 eV are ascribed to the C-S bond and satellite peak [20]. In the Se 3d spectra (Fig. 1e), three peaks are observed at 54.6, 55.3 and 56.1 eV, ascribed to the Se 3d5/2, Se 3d3/2 and C-Se bond, respectively [21].
Figure 1
Figure 1.
(a) Schematic illustration of the preparation of SnS0.5Se0.5@NSSe-C. (b) XRD patterns of SnS0.5Se0.5, NSSe-C and SnS0.5Se0.5@NSSe-C. (c) Raman spectra of N−CNF and SnS0.5Se0.5@NSSe-C. XPS spectra of the SnS0.5Se0.5@NSSe-C: (d) S 2p and (e) Se 3d, (f) TEM and (g, h) HRTEM images of SnS0.5Se0.5@NSSe-C.
Fig. S6 (Supporting information) shows the morphology of SnS0.5Se0.5 prepared by solid state method, which displays the irregular shape of several microns. Benefiting from the continuous frame structure of NSSe-C (Fig. S7 in Supporting information), the SnS0.5Se0.5@NSSe-C can maintain the fibrous structure morphology in Fig. 1f and SnS0.5Se0.5 particles with several hundred nanometers are embedded into the N/S/Se triple-doped carbon nanofibers in Fig. S8 (Supporting information). The microstructure of SnS0.5Se0.5@NSSe-C nanofibers is exhibited in Fig. 1g and the interior are solid structure. In the HRTEM image of SnS0.5Se0.5@NSSe-C nanofibers (Fig. 1h), the clear lattice fringe of 3.26 Å is observed, which is related to the (210) plane of SnS0.5Se0.5. Moreover, the TEM elemental mapping images of SnS0.5Se0.5@NSSe-C nanofibers in Fig. S9 (Supporting information) illustrate the homogeneous distribution of Sn, S, Se, N and C elements, further confirming the successful formation of the SnS0.5Se0.5@NSSe-C nanofibers.
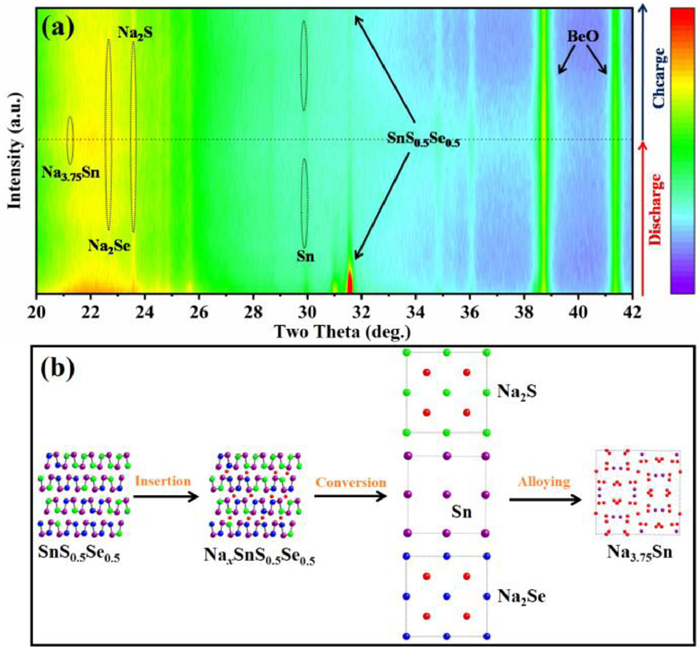
The in-situ XRD tests were carried out to reveal the sodium storage mechanism of SnS0.5Se0.5@NSSe-C nanofibers. In Fig. 2a, the intensity of the diffraction peak increases as the color changes from purple to red. The diffraction peaks corresponding to the (111) and (400) planes significantly shift to higher angles at initial discharge states (Fig. S10 in Supporting information), indicating the sodium ions insertion into the lattice with formation of NaxSnS0.5Se0.5. As continuous discharge, the characteristic peaks of Sn, Na2S and Na2Se phases are observed, corresponding to the conversion reaction of NaxSnS0.5Se0.5. When discharged to the 0.1 V, the formation of Na3.75Sn is related to the alloying reaction of Sn and observed in the HRTEM image (Fig. S11 in Supporting information) [22]. During the charge process, the weak diffraction peaks of SnS0.5Se0.5 gradually appear, implying a certain reversibility of the structure. The characteristic planes of Na2S and Na2Se intermediates still exist after the charge process, which is attributed to the loss of electrochemical activity of some sodium ions to maintain structural stability. Thus, the sodium storage mechanism of SnS0.5Se0.5 can be summarized as Fig. 2b, which is composed of insertion, conversion and alloying reactions.
Figure 2
Figure 2.
(a) In-situ XRD patterns of SnS0.5Se0.5@NSSe-C nanofibers in the first cycle and (b) the schematic diagram of sodium storage mechanism of SnS0.5Se0.5 electrode.
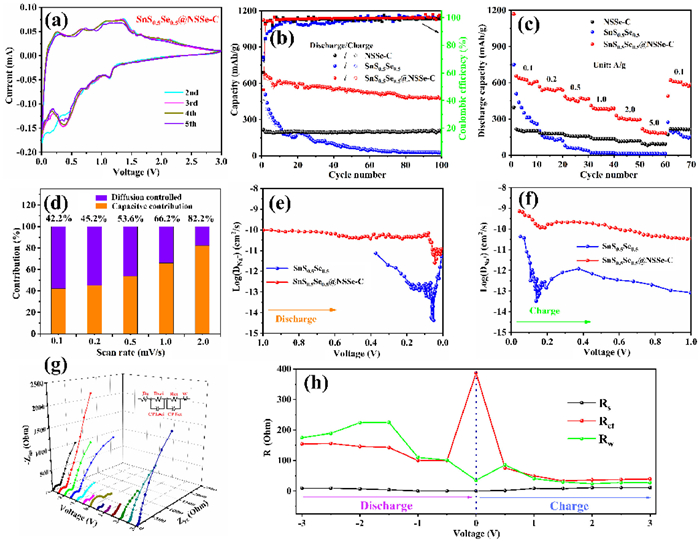
As shown in Fig. S12 (Supporting information), the three reduction peaks in the initial scan for SnS0.5Se0.5 are observed at 1.01, 0.65 and 0.14 V, corresponding to the Na+ insertion into the SnS0.5Se0.5 layer, the conversion reaction of NaxSnS0.5Se0.5 and structural activation process, and the alloying reaction of Sn, respectively. Meanwhile, the three oxidation peaks at 0.28, 0.91 and 1.04 V in the anodic scan are attributed to the desodiation process (Na3.75Sn → Sn → NaxSnS0.5Se0.5 → SnS0.5Se0.5). Compared with curves of SnS0.5Se0.5, the redox process of SnS0.5Se0.5@NSSe-C nanofibers is relatively gentle in the presence of NSSe-C, suggesting that the NSSe-C can prevent the large volume changes of active materials. In Fig. S13 (Supporting information), the subsequent CV curves (2nd to 5th) of SnS0.5Se0.5 are completely different, and some redox peaks shift or even disappear, which is ascribed to the irreversible decomposition of SnS0.5Se0.5 caused by the volume changes. On the contrary, the following CV curves of NSSe-C almost coincide in Fig. S14 (Supporting information) with excellent electrochemical reversibility. Meanwhile, Fig. 3a presents the reproducible curves of SnS0.5Se0.5@NSSe-C nanofibers, demonstrating the superior reversibility of sodiation/desodiation behavior of SnS0.5Se0.5@NSSe-C nanofibers. As displayed in Fig. S15 (Supporting information), the initial discharge and charge capacities of SnS0.5Se0.5, NSSe-C and SnS0.5Se0.5@NSSe-C nanofibers are 794.5/566.4, 448.8/214.8 and 1123.8/676.7 mAh/g at 0.1 A/g, respectively. The high discharge capacity of SnS0.5Se0.5@NSSe-C nanofibers is attributed to multiple reaction mechanisms of SnS0.5Se0.5 and the generation of solid electrolyte interphase (SEI) with more sodium ions consumption [23]. In addition, the irreversible capacity loss is mainly owing to some irreversible structural changes of SnS0.5Se0.5 and low coulombic efficiency of NSSe-C. The cycling performance of SnS0.5Se0.5, NSSe-C and SnS0.5Se0.5@NSSe-C nanofibers was evaluated at 0.1 A/g and exhibited in Fig. 3b. Obviously, the SnS0.5Se0.5 particles present the rapid capacity fading and a low capacity of 25.4 mAh/g after 100 cycles. The low conductivity and large volume expansion of SnS0.5Se0.5 may lead to the poor cycling ability with severe pulverization. Moreover, the NSSe-C nanofibers play excellent cycling stability during discharge and charge process. To determine the effect of S/Se doping on the N−CNF, the cycling and rate performance of N−CNF were tested and shown in Fig. S16 (Supporting information). The cycling capacity of NSSe-C nanofibers is higher than that of the pure N−CNF, indicating that the S/Se doping can improve the electrochemical activity of the pure N−CNF. Profiting from the high theoretical capacity of SnS0.5Se0.5 and high conductivity of the NSSe-C nanofibers, the SnS0.5Se0.5@NSSe-C nanofibers can maintain a reversible capacity of 478.8 mAh/g, much higher than the capacity of SnS0.5Se0.5. Fig. 3c compares the rate performance of SnS0.5Se0.5, NSSe-C and SnS0.5Se0.5@NSSe-C nanofibers, and the specific capacities of the SnS0.5Se0.5@NSSe-C are higher than the values of SnS0.5Se0.5and NSSe-C at various current densities. A comparison of the cycling performance of SnS0.5Se0.5@NSSe-C nanofibers for SIBs with some reported TMCs is listed in Table S1 (Supporting information) and SnS0.5Se0.5@NSSe-C nanofibers show the better sodium storage performance. Furthermore, Fig. S17 (Supporting information) shows the long cycling performance of SnS0.5Se0.5@NSSe-C nanofibers at 2.0 A/g. After five cycles at 0.1 A/g, the SnS0.5Se0.5@NSSe-C can reach a high capacity of 225.0 mAh/g after 2000 cycles, indicating the outstanding rate capability of the SnS0.5Se0.5@NSSe-C nanofibers. As presented in Fig. S18 (Supporting information), the SnS0.5Se0.5@NSSe-C with low carbon content delivers the better cycling performance than that with high carbon content, which is attributed to that more carbon content can reduce the amount of active material. It was found that no fibrous precursor was formed when the ratio of raw material (Sn: S: Se) exceeded 4:6:6. Thus, the ratio of 4:6:6 can be the best ratio to enhance the cycling capacity of SnS0.5Se0.5@NSSe-C.
Figure 3
Figure 3.
(a) CV curves of SnS0.5Se0.5@NSSe-C. (b) Cycling performance, (c) rate performance of SnS0.5Se0.5, NSSe-C and SnS0.5Se0.5@NSSe-C. (d) Capacitive contribution ratio at various scan rates of SnS0.5Se0.5@NSSe-C. The diffusion coefficients at (e) discharging and (f) charging states of SnS0.5Se0.5 and SnS0.5Se0.5@NSSe-C. (g) In-situ Nyquist plots and (h) the resistances corresponding to the in-situ Nyquist plots of SnS0.5Se0.5@NSSe-C.
To further illuminate the excellent rate capability and electrochemical reaction kinetics of SnS0.5Se0.5@NSSe-C nanofibers, the CV tests were performed from 0.1 mV/s to 2.0 mV/s and displayed in Fig. S19 (Supporting information). According to the previous studies [24,25], the relationship between the current (i) and the scan rate (v) can be expressed as the following formulas:
(1)
(2)
The calculated b values of peaks for SnS0.5Se0.5@NSSe-C nanofibers in Fig. S20 (Supporting information) are between 0.5 and 1.0, indicating that the reaction kinetics include the diffusion-controlled and capacitive behavior. Furthermore, the reaction kinetics are quantitatively analyzed by the following equation:
(3)
As revealed in Fig. 3d, the capacitive contributions of SnS0.5Se0.5@NSSe-C nanofibers are 42.2%, 45.2%, 53.6%, 66.2% and 82.2% at 0.1, 0.2, 0.5, 1.0 and 2.0 mV/s, respectively, high than those of SnS0.5Se0.5 (Fig. S21 in Supporting information). The high capacitive contribution leads to the fast charge transfer behavior, which is favorable for high rate and long cycling performance of sodium storage [26,27].
To better illustrate the extraordinary sodium storage performance of SnS0.5Se0.5@NSSe-C nanofibers, the GITT method was applied in Fig. S22 (Supporting information). The DNa+ values of SnS0.5Se0.5@NSSe-C nanofibers can be obtained according to the following equation [28]:
(4)
During the initial sodiation process (Fig. 3e), the DNa of SnS0.5Se0.5 drops slowly, attributed to that the deepening of conversion reaction can lead to the decrease in the sodium requirement. Interestingly, the alloying reaction results in the increase of the DNa approaching 0.01 V. As shown in Fig. 3f, the DNa displays a completely opposite change, which corresponds to the alloying and conversion reactions in the desodiation process. Compared to the DNa of SnS0.5Se0.5, SnS0.5Se0.5@NSSe-C nanofibers present the more table diffusion process and higher DNa values, suggesting that the introduction of NSSe-C nanofibers can solve the problems of slow ion diffusion caused by volume expansion and poor conductivity of SnS0.5Se0.5.
The sodium ion transfer kinetics and interfacial stability were investigated by EIS measurement [29]. Fig. S23 (Supporting information) exhibits the typical Nyquist plots of SnS0.5Se0.5, SnS0.5Se0.5@NSSe-C and NSSe-C after 100 cycles, which can be fitted by equivalent circuit. The Rs, Rct and Rw represent the solvent resistance, charge transfer resistance and diffusion resistance, respectively [30]. The Rct value of SnS0.5Se0.5@NSSe-C nanofibers is 154.6 Ω, higher than that of SnS0.5Se0.5 (667.1 Ω) and lower than that of NSSe-C (85.69 Ω), indicating that the high conductivity and continuous network structure of NSSe-C can shorten the diffusion distance and accelerate the charge transfer of pure SnS0.5Se0.5 particles. Moreover, the detailed in-situ Nyquist plots are shown in Fig. 3g and the corresponding impedance values are displayed in Fig. 3h. Notably, the Rs value keeps a relative stability during cycling process owing to the stable formation of SEI films. Before sodiation to 0.5 V, the Rct value decreases slowly with the depth of discharge, which is attributed to that the Sn element generated by the conversion reaction can improve the electrical conductivity and facilitate the charge transfer. However, the structural change caused by the alloying reaction and the decrease of Sn element can lead to the sluggish charge transfer and increase of the Rct value at 0.01 V. The Rw value increase at initial discharge states, which is related to the increase of interlayer spacing and internal stress caused by insertion reaction. Then, the Rw value decreases with decrease of voltage, ascribed to that subsequent conversion and alloying reactions can continue to react with sodium ions and enhance the diffusion kinetics. The Rct and Rw values show similar opposite changes during the desodiation process, indicating the excellent reversibility of charge transport and ion diffusion kinetics of SnS0.5Se0.5@NSSe-C nanofibers.
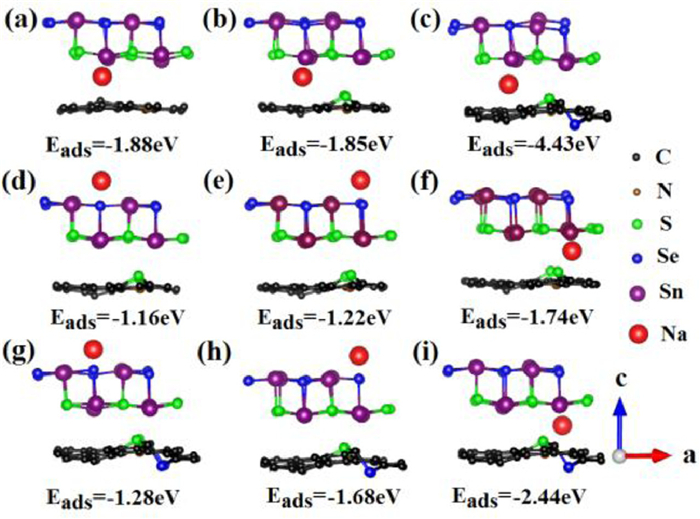
The DFT calculations were performed to reveal the structural advantages of SnS0.5Se0.5@NSSe-C nanofibers. As displayed in Figs. 4a-c, the adsorption energy (Eads) between Na+ and SnS0.5Se0.5@N−C, SnS0.5Se0.5@NS-C or SnS0.5Se0.5@NSSe-C at same adsorption sites is calculated to be −1.88, −1.85 and −4.43 eV, respectively, indicating the stronger interaction of SnS0.5Se0.5 adsorption on NSSe-C. The higher negative adsorption energy illustrates more electrochemical active site in the SnS0.5Se0.5@NSSe-C, which are beneficial for sodium storage performance [31,32]. The Eads between Na+ and SnS0.5Se0.5@NS-C or SnS0.5Se0.5@NSSe-C at the different adsorption sites is further calculated and presented in Figs. 4d-i. The SnS0.5Se0.5@NSSe-C composite delivers the better Na+ adsorption performance than SnS0.5Se0.5@NS-C, demonstrating great sodium storage potential. The results also prove that the interlayer between SnS0.5Se0.5 and NSSe-C is more conducive to sodium ion insertion.
Figure 4
Figure 4.
Geometries of the optimized (a) SnS0.5Se0.5@N−C, (b) SnS0.5Se0.5@NS-C and (c) SnS0.5Se0.5@NSSe-C at the same sodium atom adsorption sites. Geometries of the optimized (d-f) SnS0.5Se0.5@NS-C and (g-i) SnS0.5Se0.5@NSSe-C at the different sodium atom adsorption sites.
In summary, the SnS0.5Se0.5 nanoparticles coupled with N/S/Se triple-doped carbon nanofibers (SnS0.5Se0.5@NSSe-C) have been synthesized through two-step process, and investigated as an anode material for SIBs. Due to the synergistic effect of SnS0.5Se0.5 and NSSe-C, the SnS0.5Se0.5@NSSe-C composite delivers superior sodium storage performance with ultralong cycle life at a high current density and fast reaction kinetics. This work can provide an intelligent strategy for the efficient construction of high-performance electrodes with fast electrochemical reaction kinetics and increase the understanding of the sodium-storage mechanism in ternary tin-based chalcogenides.
Declaration of competing interest
The authors declare that they have no known competing financial interests or personal relationships that could have appeared to influence the work reported in this paper.
Acknowledgments
This work was supported by National Natural Science Foundation of China (No. U1832147), Jiangsu Provincial Double-Innovation Doctor Program (No. JSSCBS20210743), Anhui Key Laboratory of low temperature Co-fired Materials (No. 2022LCA04), The Doctor of Suzhou University Scientific Research Foundation Project (No. 2020BS014). The authors also acknowledge the thanks for the great support from the material studio software.
Supplementary materials
Supplementary material associated with this article can be found, in the online version, at doi:10.1016/j.cclet.2023.108552.
References
[1]
M.A.T. Rogers, Nature 151(1943) 504.
[2]
A. Loudet, K. Burgess, Chem. Rev. 107(2007) 4891-4932.
doi: 10.1021/cr078381n
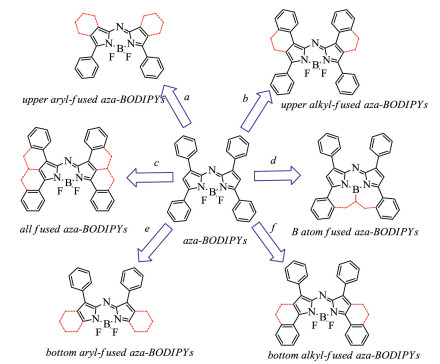
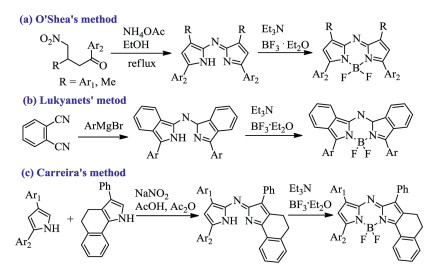
Scheme 2. Strategies for the NIR absorbing (λabs > 700 nm) aza-BODIPYs.
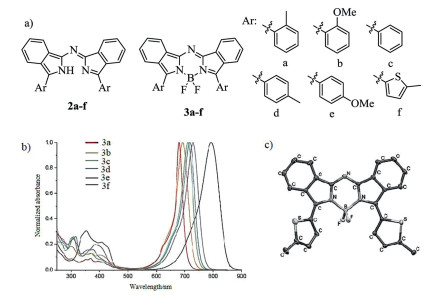
Figure 1. Molecular structures, absorption spectra and single crystal. (a) Structures of dyes 2a–3f. (b) Absorption spectra of 3a–f. (c) X-ray analysis of 3f. Reproduced with permission [34]. Copyright 2011, John Wiley and Sons.
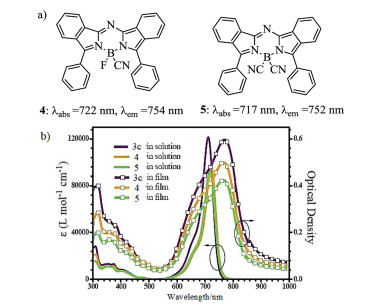
Figure 2. Molecular structures and absorption spectra. (a) Aza-BODIPYs with bearing the –CN group. (b) Absorption spectra of 3c, 4 and 5 in CH2Cl2 solution and in film. Reproduced with permission [32]. Copyright 2017, John Wiley and Sons.
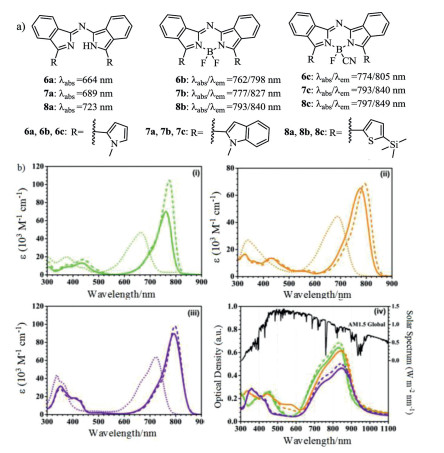
Figure 3. Molecular structures and absorption spectra. (a) Structures of dyes 6–8. (b) Absorption spectra of 6a–c (ⅰ), 7a–c (ⅱ) and 8a–c (ⅲ) in CH2Cl2 (1 × 10⁻⁵ mol/L) and (ⅳ) the absorption spectra in solid state as 50 nm thin film on glass. Reproduced with permission [33]. Copyright 2017, Royal Society of Chemistry.
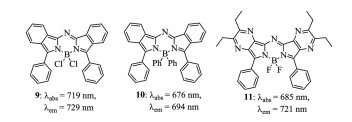
Figure 4. Structures of aza-BODIPYs 9–11.
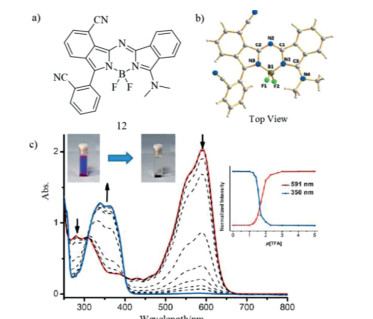
Figure 5. Molecular structures, single crystal and absorption change. (a) Benzo-fused aza-BODIPY 12 and (b) X-ray analysis of dye 12. (c) Absorption spectra of aza-BODIPY 12 with TFA. Reproduced with permission [37]. Copyright 2015, John Wiley and Sons.
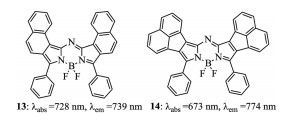
Figure 6. Structures of aza-BODIPYs 13 and 14.
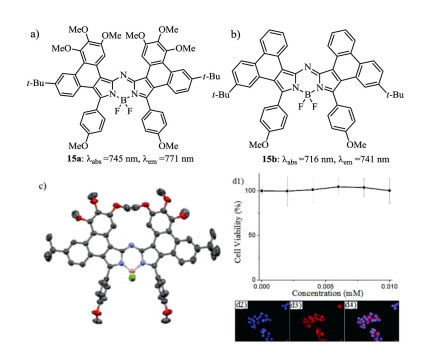
Figure 7. Structures of (a) aza-BODIPY 15a and (b) aza-BODIPY 15b. (c) X-ray analysis of 15a. (d1) Fluorescence images of HepG2 cells stained with 15a (5.0 µmol/L) and DAPI (1.67 µg/mL), d2) DAPI fluorescence, (d3) 15a fluorescence, and (d4) merged images of parts d2 and d3. Reproduced with permission [31]. Copyright 2017, American Chemical Society.
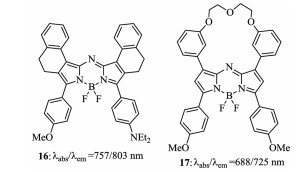
Figure 8. Structures of the upper phenyl-restricted aza-BODIPY 16 and 17.
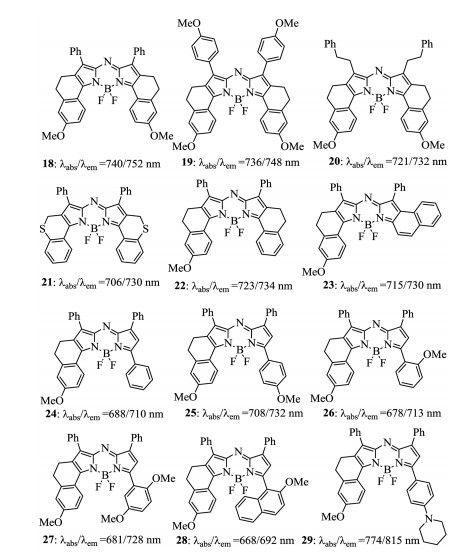
Figure 9. Structures of aza-BODIPY dyes 18–29.
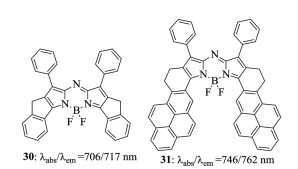
Figure 10. Five-membered-ring fused aza-BODIPY 30 and pyrene-containing aza-BODIPY 31.
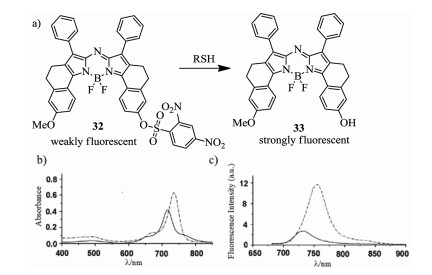
Figure 11. Reaction mechanism and spectral variation. (a) Reaction of aza-BODIPY with RSH. (b) Absorption and (c) Emission spectra (λex = 670 nm) of probe 32 before (solid curve) and after (dashed curve) the addition of cysteine. Reproduced with permission [54]. Copyright 2012, Royal Society of Chemistry.
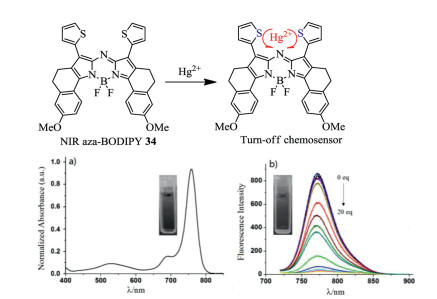
Figure 12. Spectral changes of (a) absorption spectrum of NIR fluorescent probe 34 with Hg2+. (b) Emission spectra of NIR fluorescent probe 34 with Hg2+. Reproduced with permission [55]. Copyright 2015, Elsevier.
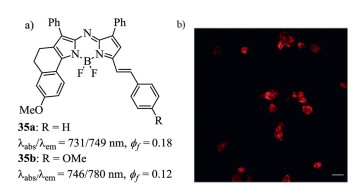
Figure 13. Molecular structures and cell staining. (a) Styryl-containing aza-BODIPYs 35. (b) Image of living cells stained by dye 35b. Reproduced with permission [56]. Copyright 2014, Royal Society of Chemistry.
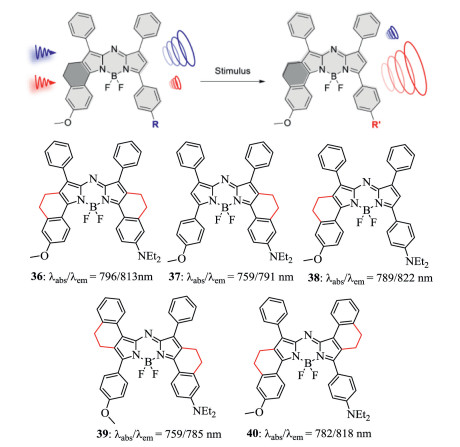
Figure 14. Restricted-aryl aza-BODIPY dyes 36–40. Reproduced with permission [43]. Copyright 2019, American Chemical Society.
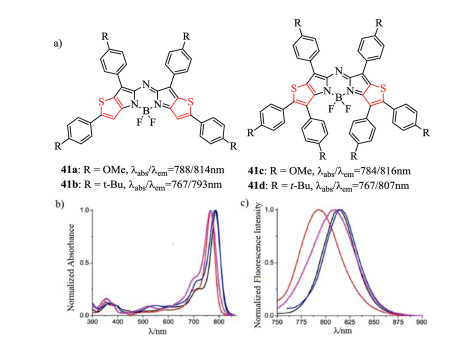
Figure 15. Molecular structures and optical spectra. (a) Thiophenyl-fused aza-BODIPYs 41. (b) Normalized UV−vis and (c) fluorescence spectra of aza-BODIPYs 41a (black), 41b (red), 41c (blue), 41d (magenta) in chloroform. Reproduced with permission [58]. Copyright 2014, American Chemical Society (For interpretation of the references to color in this figure legend, the reader is referred to the web version of this article.).
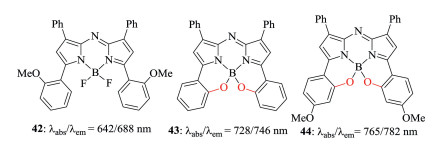
Figure 16. B, Ochelated aza-BODIPYs.
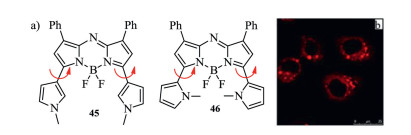
Figure 17. Molecular structures and cell staining. (a) Methylpyrrolyl-containing aza-BODIPYs. (b) Image of living cells stained by dye 46. Reproduced with permission [61]. Copyright 2016, John Wiley and Sons.
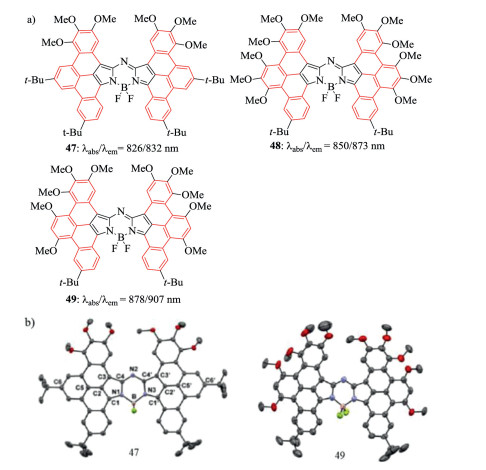
Figure 18. Molecular structures and single crystal. (a) Aza-BODIPYs 47, 48 and 49. (b) X-ray crystal structures 47 and 49. Reproduced with permission [62]. Copyright 2018, American Chemical Society.

 Login In


 DownLoad:


 DownLoad: