Figure 1.
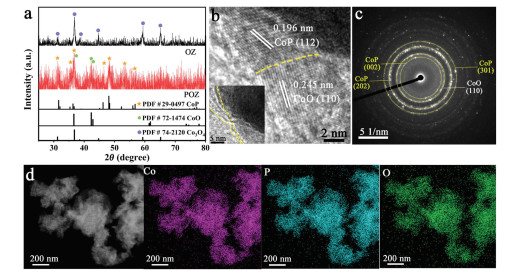
(a) XRD patterns. (b) HRTEM, (c) SAED and (d) EDS elemental mapping images of POZ.

Phosphating-induced charge transfer on CoO/CoP interface for alkaline H2 evolution
Qian Li , Yuchao Wang , Jian Zeng , Qiumei Wu , Qichen Wang , Lian Sun , Liang Xu , Tong Ye , Xin Zhao , Lei Chen , Zhiyan Chen , Limiao Chen , Yongpeng Lei


Hydrogen (H2) is regarded as an ideal clean energy due to its high heating value and pollution-free combustion products [1-3]. Electrochemical water splitting using clean electricity from solar (or wind, etc.) under mild conditions has been considered as one of the most promising methods [4, 5]. In order to produce H2 at a large scale, it should meet the actual requirements of industrial current density (over 400 mA/cm2) [6, 7]. Compared to acidic media, H2 evolution reaction (HER) occurred under alkaline media possesses more practical value [8, 9]. But the extremely low proton concentration in alkaline electrolyte slows down the reaction kinetics, and additional energy is required to dissociate H2O molecules [10, 11]. Hence, evaluating the HER performance in alkaline media has attracted wide attention [12, 13]. Pt-based materials are generally considered to be excellent catalysts for HER [14, 15]. Unfortunately, the scarcity and high price severely hindered the wide application [16, 17]. Therefore, it is of crucial importance to synthesize non-noble metal electrocatalysts that can obtain excellent HER performance in alkaline electrolyte.
Owing to rich redox properties, transition metal oxides (TMOs) with high abundance have presented reasonable activity and stability in catalytic reactions [18]. Unfortunately, due to the large band gap and low electrical conductivity, TMOs generally displayed inappropriate H2 adsorption capacity. Thus, developing efficient and universal modulation strategies to optimize their HER property is necessary [19, 20]. Commonly used modulation strategies include doping modification [20, 21], defect engineering [22, 23], interface engineering [24-28] and Schottky junction construction [29], etc. Constructing a heterostructure catalyst to adjust the charge distribution is crucial to improve the electrocatalytic properties of TMOs. For instance, Luo et al. [26] reported that the CeO2 nanoparticles with abundant oxygen vacancies stably anchored on Co4N nanorod arrays, which would synergistically adjust both the water dissociation and hydrogen adsorption behavior, thus showing outstanding activity toward HER. Similarly, a unique CoMoO4-Co2Mo3O8 heterostructure was built by Tu et al. [30], which synergistically optimized the electron distribution of CoMoO4 and Co2Mo3O8 to reduce hydrogen adsorption energy, thus significantly improving HER activity. Although some progress has been made, the HER activity of TMOs, especially in alkaline electrolyte, is still far from satisfactory, which severely limits their future application [20].
In this work, the CoO/CoP heterostructure catalyst (termed POZ) was synthesized. POZ required an overpotential of 236 mV to achieve the current density of 400 mA/cm2 in 1.0 mol/L KOH, which was 249 mV lower than that of non-phosphated sample (named OZ). As proved by experimental results and density functional theory (DFT) calculations, the strong electron transfer from CoP to CoO on the interface facilitated the occurrence of HER. The steady conversion of solar-to-hydrogen (STH) with a relatively high efficiency of 10.5% demonstrated its potential in solar-driven water splitting.
POZ was synthesized by an oxidation-phosphidation strategy towards zeolitic imidazolate framework-67 (ZIF-67) (Fig. S1 in Supporting information). The structure of POZ and OZ was characterized by X-ray diffraction (XRD) patterns (Fig. 1a). After background removal, typical diffraction peaks located at 31.6°, 32.0°, 36.3°, 46.2°, 48.1°, 52.2°, 56.3° can be discovered, corresponding to the (011), (002), (111), (112), (211), (103), (212) facets of CoP (PDF # 29-0497), respectively. Three peaks at 2θ = 36.6°, 42.3°, 42.8° were well consistent with (110), (111), (200) facets of CoO (PDF # 72-1474), indicating the successful construction of CoO/CoP interface in POZ. The peak positions of 31.2°, 36.8°, 38.5°, 44.8°, 59.3° and 65.2° in OZ were respectively indexed to (220), (311), (222), (400), (511) and (440) facets of Co3O4 (PDF # 74-2120). The above results indicate that the composition changed from OZ to POZ after phosphating.
High-resolution transmission electron microscopy (HRTEM) image of POZ presents an interface between CoP and CoO species (Fig. 1b). The lattice spaces of 0.196 and 0.245 nm were assigned to the (112) plane of CoP and (110) plane of CoO, respectively. The illustration inFig. 1b also confirms the existence of amorphous carbon layer at the edge, which is derived from the ZIF-67 precursor [31]. The above results were also verified by the X-ray photoelectron spectroscopy (XPS) (Fig. S2 in Supporting information). This carbon layer would provide the channel for electron transportation, thus accelerating the reaction kinetics [32, 33]. The selected area electron diffraction (SAED) image shows that the main diffraction rings match well with CoP and CoO (Fig. 1c). In addition, the corresponding energy-dispersive X-ray spectroscopic (EDS) elemental mapping images display the uniform distribution of Co, P and O in the whole sample (Fig. 1d). According to the inductively coupled plasma optical emission spectroscopy (ICP-OES) measurement, the amounts of Co and P in POZ are 40.11 wt% and 21.57 wt%, respectively.
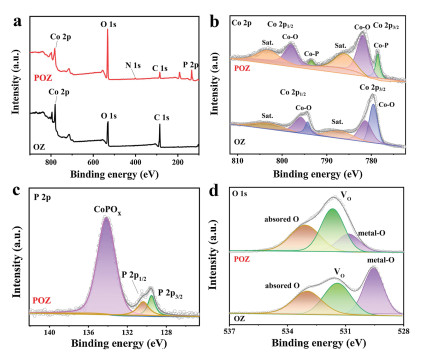
Then, XPS survey spectrum identifies the presence of Co, P, O, C and N (Fig. 2a). In the high-resolution Co 2p spectra of OZ, the peaks at 779.5/794.3 and 781.3/795.8 eV respectively, correspond to Co3+–O and Co2+–O coordination, confirming the existence of Co3O4 phase (Fig. 2b) [34]. After phosphating, the new Co–P coordination appears in POZ at the binding energies of 778.5 and 793.4 eV, which proves the formation of CoP species and CoO/CoP interface [11]. At the meantime, the peaks of Co-O coordination shift to higher binding energies, indicating the electron transfer inside CoO/CoP heterostructure [35, 36]. For P 2p, the binding energies of peaks are located at 129.5 and 130.3 eV, corresponding to the P 2p3/2 and P 2p1/2 in CoP. And the peak at 134.1eV originates from the surface oxidation of CoP (Fig. 2c) [35, 37]. The P plays a role in moderating the bonding between reaction intermediates and surface active sites, thereby promoting HER [38]. As shown in Fig. 2d, OZ has three characteristic peaks: 529.6, 531.4 and 532.9 eV, corresponding to metal–O, O defect sites and adsorbed molecular water, respectively [34, 39]. The weakening and shift of the peak at 529.6 eV indicates that the binding energy of Co–O has changed due to the insertion of P atoms. Moreover, the C 1 s spectrum was fitted to three peaks at 284.7, 286.4 and 288.7 eV, belonging to the C-C, C-O and O-C=O, respectively (Fig. S2) [32, 40]. Noting that the binding energy shifts are all observed for Co 2p, O 1 s, and C 1 s, suggesting a strong electronic interaction on CoO/CoP interface. Such strong electronic interaction will influence the charge distribution between CoO and CoP active components [41]. Fu and coworkers [41] also proved this point by developing a porous In-doped CoO/CoP heterostructure with rich oxygen vacancies to enhance charge transport, thus accelerating the reaction kinetics.
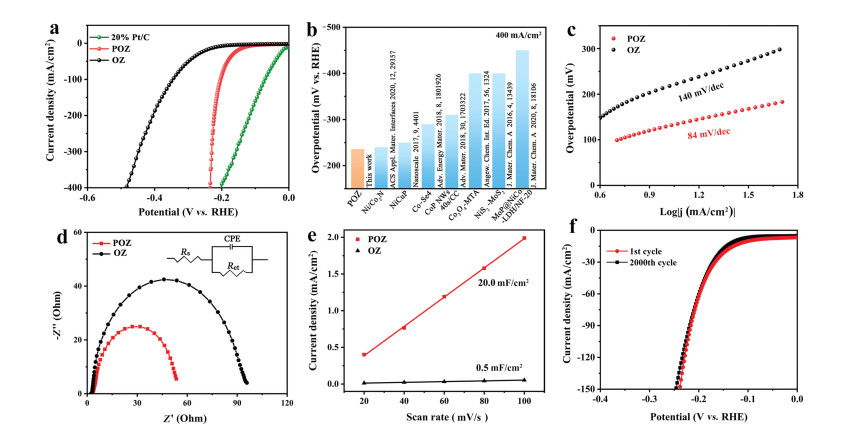
The HER activity of POZ was further investigated in 1.0 mol/L KOH solution.Fig. 3a shows the linear sweep voltammetry (LSV) curves. To achieve a current density of 400 mA/cm2, the overpotential of POZ was 236 mV, much lower than that of OZ (485 mV), closing to Pt/C (203 mV) and exceeding most reported non-noble metal based HER electrocatalysts (Fig. 3b). Tafel slopes of POZ and OZ are 84 and 157 mV/dec (Fig. 3c), respectively, indicating that POZ had faster reaction kinetics and followed the Volmer-Heyrovský mechanism [42]. In addition, electrochemical impedance spectroscopy (EIS) measurements were carried to evaluate the charge transport capability of all samples. The Nyquist plots were fitted into the equivalent electronic circuit, which was consisted of solution diffusion resistance (Rs), charge transfer resistance (Rct) and constant phase element (CPE). The Nyquist plots shown in Fig. 3d suggest that POZ possesses lower charge transport resistance than OZ, indicating the faster charge transfer. The double layer capacitance (Cdl) related to electrochemical surface area (ECSA) was also used to estimate the intrinsic HER activity of catalysts. The cyclic voltammetry (CV) curves of all samples at different scanning rates were shown in Fig. S3 (Supporting information) in the non-Faradaic region. POZ exhibited a slope of 20 mF/cm2, much larger than that of OZ (0.5 mF/cm2) in 1.0 mol/L KOH (Fig. 3e). It is worth noting that POZ had a larger surface area and exposed more active sites toward HER. Moreover, the HER stability of POZ was also studied. After 2000 CV cycles, only a negligible performance degradation was detected, further confirming the superb stability (Fig. 3f). Chronopotentiometric curve at a constant current density of 10 mA/cm2 also displayed a great durability (Fig. S4 in Supporting information).
Furthermore, the DFT calculations were used to analyze the interface charge effect of CoO/CoP heterostructure (calculated models are shown in Fig. S5 in Supporting information) [37, 43].Fig. 4a plots the three-dimensional charge density difference. We can see that there is a large charge transfer between the CoO and CoP, and the deformed heterostructure crystal further demonstrates a strong coupling between CoO and CoP. In order to clarify the direction of charge transfer and its underlying mechanism, the planar averaged electrostatic potential and charge density difference (positive value represents charge accumulation, negative value represents charge depletion) across the interface of CoO/CoP were given in Fig. 4b. Obviously, CoO had much higher averaged electrostatic potential than CoP, indicating a strong built-in electric field acrossed the interface, driving electrons transfer from CoP to CoO. A more accurate Bader analysis demonstrates that there are 0.077 electrons per atom gather at CoO side. Therefore, the reducing ability of CoO was greatly enhanced due to the obtained large amount of reducing electrons. And the HER activity of CoO was significantly improved by forming CoO/CoP heterostructure.
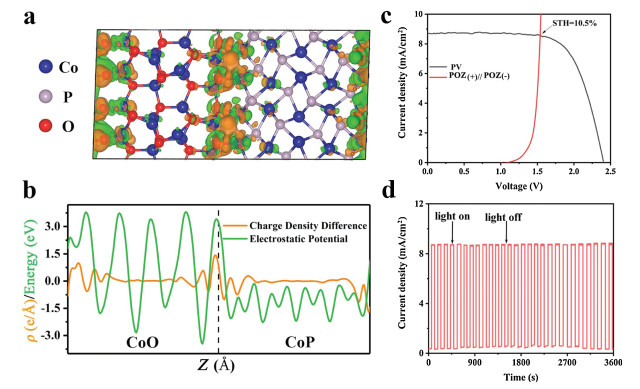
Moreover, CoO/CoP heterostructure catalysts have also been applied to other electrocatalytic reactions. Zhu et al. [18] reported that the lateral heterostructure of Fe-containing CoP/CoO had a strong interfacial coupling effect between CoP and CoO, which induced the redistribution of electrons, thus promoting the adsorption of OH− anions and showing excellent electrocatalytic oxygen evolution reaction (OER) performance. Here, POZ exhibited a low overpotential of 320 mV to achieve 10 mA/cm2 for OER (Fig. S6 in Supporting information), which presents its bifunctional activity. Thus, we used POZ as both anode and cathode for water splitting in 1.0 mol/L KOH electrolyte. A voltage of 1.72 V at the current density of 10 mA/cm2 was obtained (Fig. S7 in Supporting information). Using solar power to drive water splitting for H2 is attractive and a high STH efficiency is expected [44-46]. As shown inFig. 4c, combining the J-V curve of the solar cell (under the simulated sunlight of AM 1.5 G, 100 mW/cm2) and the polarization curve of the POZ for water splitting, the operating current density of the system reached 8.6 mA/cm2 with the voltage of 1.5 V, meaning a STH efficiency of 10.5% [47]. The excellent performance of the system remains stabled up to 3600 s (including 27 consecutive on/off lighting cycles) in Fig. 4d.
In summary, POZ showed a great electrocatalytic HER activity at the large current densities. It only needed a low overpotential of 236 mV to drive 400 mA/cm2 and a STH efficiency of 10.5%. Experimental and theoretical analysis demonstrate that the existence of CoO/CoP heterostructure promoted electron transfer from CoP to CoO on the interface, thus accelerating HER reaction kinetics. This work may offer a great potential in developing non-noble metal electrocatalysts under a large current density toward alkaline HER.
The authors report no declarations of interest.
Y. Lei thanks the financial support from the Hunan Provincial Science and Technology Plan Project (Nos. 2017TP1001, 2020JJ4710). L. Xu thanks National Natural Science Foundation of China (No. 11764018) and the Natural Science Foundation of Jiangxi Province (No. 20202ACBL211004). Z. Chen thanks Changsha Science and Technology Plan (No. kq1801079). L. Chen thanks National Natural Science Foundation of China (No. 21776317).
Supplementarymaterial related to this article canbefound, in the online version, at doi:https://doi.org/10.1016/j.cclet.2021.03.063.
H.Q. Zhou, F. Yu, Q. Zhu, et al., Energy Environ. Sci. 11 (2018) 2858-2864 doi: 10.1039/c8ee00927a
Y. Lei, Y.C. Wang, Y. Liu, et al., Angew. Chem. Int. Ed. 59 (2020) 20794-20812 doi: 10.1002/anie.201914647
L. Wang, Z.J. Li, K.X. Wang, et al., Nano Energy 74 (2020) 104850 doi: 10.1016/j.nanoen.2020.104850
F.P. Cheng, Z.J. Li, L. Wang, et al., Mater. Horiz. 8 (2021) 556-564 doi: 10.1039/d0mh01757d
T.T. Wang, Q.D. Zhao, Y.Y. Fu, et al., Small Methods 3 (2019) 1900210 doi: 10.1002/smtd.201900210
H.L. Huang, C. Yu, X.T. Han, et al., Energy Environ. Sci. 13 (2020) 4990-4999 doi: 10.1039/d0ee02607g
X.T. Yu, M.Y. Wang, X.Z. Gong, et al., Adv. Energy Mater. 8 (2018) 1802445 doi: 10.1002/aenm.201802445
X.X. Chen, X.J. Zhen, H.Y. Gong, et al., Chin. Chem. Lett. 30 (2019) 681-685 doi: 10.1016/j.cclet.2018.09.017
C.Y. Song, Y. Liu, Y.C. Wang, et al., Sci. China Mater. (2021), DOI: 10.1007/s40843-020-1566-6
Y.C. Wang, Y. Liu, W. Liu, et al., Energy Environ. Sci. 13 (2020) 4609-4624 doi: 10.1039/d0ee02833a
Y. Liu, Q.G. Feng, W. Liu, et al., Nano Energy 81 (2021) 105641 doi: 10.1016/j.nanoen.2020.105641
F.P. Cheng, L. Wang, H.Q. Wang, et al., Nano Energy 71 (2020) 104621 doi: 10.1016/j.nanoen.2020.104621
Y.H. Wang, R.Q. Li, H.B. Li, et al., Rare Metals (2021), DOI: 10.1007/s12598-020-01665-1
C.S. Lei, W. Zhou, Q.G. Feng, et al., Nano-Micro Lett. 11 (2019) 45 doi: 10.1007/s40820-019-0279-8
W. Hua, H.H. Sun, F. Xu, J.G. Wang, Rare Metals 39 (2020) 335-351 doi: 10.1007/s12598-020-01384-7
Q.C. Wang, Y. Lei, Y.C. Wang, et al., Energy Environ. Sci. 13 (2020) 1593-1616 doi: 10.1039/d0ee00450b
L. Chen, Y.H. Song, Y. Liu, et al., J. Energy Chem. 50 (2020) 395-401 doi: 10.1016/j.jechem.2020.03.046
X.M. Hu, S.L. Zhang, J.W. Sun, et al., Nano Energy 56 (2019) 109-117 doi: 10.1016/j.nanoen.2018.11.047
F.L. Lai, J.R. Feng, X.B. Ye, et al., J. Mater. Chem. A 7 (2019) 827-833 doi: 10.1039/c8ta10162k
T. Ling, T. Zhang, B.H. Ge, et al., Adv. Mater. 31 (2019) 1807771 doi: 10.1002/adma.201807771
H.T. Xu, T.Y. Liu, S.X. Bai, et al., Nano Lett. 20 (2020) 5482-5489 doi: 10.1021/acs.nanolett.0c02007
Q. Han, Z.H. Cheng, J. Gao, et al., Adv. Funct. Mater. 27 (2017) 1606352 doi: 10.1002/adfm.201606352
Q. Han, Z.H. Cheng, B. Wang, H.M. Zhang, L.T. Qu, ACS Nano 12 (2018) 5221-5227 doi: 10.1021/acsnano.7b08100
J. Zeng, L. Xu, X. Luo, et al., Phys. Chem. Chem. Phys. 23 (2021) 2812-2818 doi: 10.1039/d0cp05238h
L. Xu, J. Zeng, Q. Li, et al., Appl. Surf. Sci. 530 (2020) 147181 doi: 10.1016/j.apsusc.2020.147181
N. Yao, R. Meng, F. Wu, et al., Appl. Catal. B: Environ. 277 (2020) 119282 doi: 10.1016/j.apcatb.2020.119282
L.L. Liao, J.Y. Sun, D.Y. Li, et al., Small 16 (2020) 1906629 doi: 10.1002/smll.201906629
D.Y. Li, L.L. Liao, H.Q. Zhou, et al., Mater. Today Phys. 16 (2021) 100314 doi: 10.1016/j.mtphys.2020.100314
Y.C. Wang, B. Liu, Y. Liu, et al., Chem. Commun. 56 (2020) 14019-14022 doi: 10.1039/d0cc05656a
Z. Liu, C.H. Zhan, L.K. Peng, et al., J. Mater. Chem. A 7 (2019) 16761 doi: 10.1039/c9ta04180j
X. Yang, P. Wang, Y.W. Tang, et al., Ionics 25 (2019) 2945-2950 doi: 10.1007/s11581-019-02982-x
Y. Xu, W.G. Tu, B.W. Zhang, et al., Adv. Mater. 29 (2017) 1605957 doi: 10.1002/adma.201605957
L. Chen, C.Z. He, R. Wang, et al., Chin. Chem. Lett. 32 (2021) 53-56 doi: 10.1016/j.cclet.2020.11.013
J.K. Wang, R. Gao, L.R. Zheng, et al., ACS Catal. 8 (2018) 8953-8960 doi: 10.1021/acscatal.8b01023
Y. Pan, K.A. Sun, S.J. Liu, et al., J. Am. Chem. Soc. 140 (2018) 2610-2618 doi: 10.1021/jacs.7b12420
Y. Liu, C.Y. Song, Y.C. Wang, et al., Chem. Eng. J. 401 (2020) 126038 doi: 10.1016/j.cej.2020.126038
G.Y. Zhou, M. Li, Y.L. Li, et al., Adv. Funct. Mater. 30 (2019) 1905252
R. Zhang, C. Tang, R.M. Kong, et al., Nanoscale 9 (2017) 4793-4800 doi: 10.1039/C7NR00740J
Q.C. Wang, X.X. Xue, Y. Lei, et al., Small 16 (2020) 2001571 doi: 10.1002/smll.202001571
X. Yuan, W.B. Yue, J. Zhang, J. Cent. South Univ. 27 (2020) 2515-2529 doi: 10.1007/s11771-020-4477-9
W. Jin, J.P. Chen, B. Liu, et al., Small 15 (2019) 1904210 doi: 10.1002/smll.201904210
M. Driess, S. Anantharaj, S. Noda, et al., Angew. Chem. Int. Ed. (2021) DOI: 10.1002/anie.202015738
G.Z. Fang, Q.C. Wang, J. Zhou, et al., ACS Nano 13 (2019) 5635-5645 doi: 10.1021/acsnano.9b00816
Y. Kuang, M.J. Kenney, Y.T. Meng, et al., Proc. Natl. Acad. Sci. U.S.A. 116 (2019) 6624 doi: 10.1073/pnas.1900556116
J.Y. Jia, L.C. Seitz, J.D. Benck, et al., Nat. Commun. 7 (2016) 13237 doi: 10.1038/ncomms13237
S.H. Hsu, J.W. Miao, L.P. Zhang, et al., Adv. Mater. 30 (2018) 1707261 doi: 10.1002/adma.201707261
J. Gao, F. Sahli, C.J. Liu, et al., Joule 3 (2019) 2930-2941 doi: 10.1016/j.joule.2019.10.002

Figure 1 (a) XRD patterns. (b) HRTEM, (c) SAED and (d) EDS elemental mapping images of POZ.

Figure 2 (a) XPS survey spectrum. High-resolution (b) Co 2p, (c) P 2p, and (d) O 1 s spectra.

Figure 3 (a) LSV curves for HER. (b) The overpotentials of different catalysts in recent 5 years. (c) Corresponding Tafel slopes. (d) EIS Nyquist plots and (e) double-layer capacitance (Cdl) of different samples. (f) Polarization curves of POZ before and after 2000 CV cycles.

Figure 4 (a) Charge density difference between CoO and CoP in phase boundaries, electron accumulation and depletion are represented by yellow and green bubbles, respectively. (b) Planar averaged charge density difference and electrostatic potential. (c) J-V curve of a solar cell and the polarization curve of POZ water splitting device in a two-electrode configuration. (d) Current density-time curve of the solar-driven water splitting device under Xe light.

 扫一扫看文章


扫一扫关注我们
 DownLoad:
 下载:
下载:
 下载:
下载: