Figure 1.
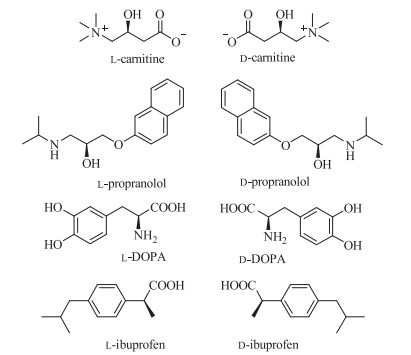
Representative examples of enantiomers with pharmaceutical effects.

Enantiomers, a pair of isomers with opposite handedness, are mirror images of each other, and could not superimpose on the counterpart. Although equipped with identical functional groups and compositions, those twins of isomers exhibit significantly distinct properties, such as pharmacological, biological, and physiological performances. The prefix of L/D (S/R) in front of the notation are introduced to denote corresponding enantiomers. As exemplified in Fig. 1, L-carnitine is a non-essential amino acid that usually functions as a nutritional supplement, in contrast, Dcarnitine is harmful to human health, since it inhibits the reactivity of L-carnitine [1]. The pharmacological potency of L-propranolol is around 100 times more effective than D-propranolol on blocking β-adrenoceptors, and for treating heart disease [2]. In this case, Lpropranolol, instead of racemic mixtures, could be supplied with higher efficiency and lower cost in terms of pharmacological doses [3, 4]. L-DOPA (L-dihydroxy-3, 4-phenylalanine) is a first-line treatment for Parkinson's disease, however, its isomer, D-DOPA (D-dihydroxy-3, 4 phenylalanine) is toxic and leads to granulocytosis [1]. As a generic medicine, only L-ibuprofen is active toward inhibiting cyclooxygenase, reducing prostaglandin synthesis, producing analgesic and anti-inflammatory effects, with L-isomer around 100-fold more potent than D-ibuprofen [5, 6]. The introduction of pure enantiomer could reduce the total dose, enhance the clinical efficacy, reduce the burden of drug metabolism, and lower potential side effects. As a result, the enantioselective analyses are urgently needed in a broad spectrum of pragmatic circumstances, and also lead to the burgeoning development of various methodologies in analytical chemistry [7].
Noble metal and semiconductor nanomaterials, with fascinatingly plasmonic and excitonic properties, after further coupling with chirality through deliberate modifications, played critical roles on the enantioselective analysis [8-11]. Noble metal and semiconductor nanomaterials provide a particularly useful platform for the identification and detection of enantiomers, and have been widely used in biosensing, with higher sensitivity, simpler operation, cheaper cost, and lower detection limit [12, 13]. Built on corresponding nanomaterials, scientists have developed biosensors for chemical molecules (antibiotics, toxins, amino acid, etc.) and bio-macromolecules (for example, protein and DNA) [14].
Based on the main mechanism of enantioselective analysis, we could classify corresponding application of noble metal and semiconductor nanomaterials into three categories: fluorescence-based, colorimetry-based, and circular dichroism (CD)-based analysis. In general, the intentionally planted homo- and heterochiral pairs were hybridized with the electronic states of noble metal or semiconductor nanomaterials, and corresponding signals from electronic excitation/relaxation could be amplified during the interactions between the isomers with the same/opposite handedness. Hybridization between chiral analytes and noble metal/semiconductor nanomaterials could extend the response/detection range into visible region, since most of those chiral analytes have limited absorption in the ultraviolet (UV) region. In addition, nanomaterials have a high specific surface area, the enrichment of chiral analytes on the surface that are sensitive to the stereo-geometry of chiral molecules could boost analysis efficiency. As a result, enantioselective analysis through noble metal and semiconductor nanomaterials led to excellent sensitivity/selectivity.
In fluorescence-based analysis, chiral analytes could influence the fluorescence intensity and peak shift of nanomaterials, through the specific chiral recognition between analytes and nanomaterials. Luminescence of noble metal was attributed to the plasma emission process, with multiples channels, such as the interband transition of d-band electrons into the conduction band, and the subsequently radiative recombination, or the non-radiative recombination of the excited d-band holes and sp electrons, and consequently radiative decay of the surface plasmons [15-17]. Fluorescent analysis based on noble metal nanomaterials could be divided among two sub-categories. First, fluorescence resonance energy transfer (FRET), the efficient energy transfer from the donors to the acceptors (such as noble metal nanomaterials) could take place exclusively and specifically, through the chiral analytes with certain handedness [18, 19]. Second, fluorescence quenching, the photoinduced electron transfer from the nanomaterials to chiral analytes varies significantly among isomers, due to the different steric hindrance between enantiomers [18]. Similarly, enantioselective analysis based on the fluorescence of semiconductor nanomaterials, which originated from the radiative relaxation of excited excitons at the band-edge positions, could be categorized into two sub-groups. First, fluorescence intensity was significantly reduced, as electrostatic interactions/hydrogen bonds between chiral analytes and nanomaterials could replace original ligands that inhibit non-radiative relaxation channels. Second, quantum yield of fluorescence was increased since increased radiative relaxation rate or repressed non-radiative relaxation was induced by stereoselective interactions between chiral analytes and the nanomaterials.
In colorimetry-based analysis, chiral electronic transitions could be bestowed onto the surfaces of achiral nanomaterials by attachment of chiral molecules. In the presence of chiral ligands, unique absorption peaks were induced by the ortho-effect or chiral electrostatic action of ligands [20]. Noble metal nanomaterials have high extinction coefficient and distance-dependent optical properties, and could be used as ideal color reporting materials [21]. Given the optical properties (absorption/scattering) of noble metal nanomaterials were sensitive to adjacent distance, whose change could be triggered by chiral analytes, and led to color changes appreciable by naked eyes [22, 23].
In CD-based analysis, during exciting surface plasmon resonance (SPR) of noble metal nanomaterials or the exciton transitions in semiconductor nanomaterials, the difference in the absorption of left-handed circularly polarized light (L-CPL) and right-handed circularly polarized light (R-CPL), could localize the chiral centers from the enormous amount of achiral ones. CD signals can be positive or negative, depending on whether L-CPL is more absorbed than R-CPL (CD positive) or less (CD negative). The SPR of noble metal nanomaterials induced the enhancement of molecular CD signal and the emergence of new spectral signals. Those phenomena have two mechanisms: First, the change of the electromagnetic field in the chiral molecule induced by the plasma; second, the dipoles of chiral molecules induce chiral currents in noble metal nanomaterials [24, 25]. The CD of semiconductor are associated with near-surface atoms that are enantiomerically distorted by the chiral ligands, which reflects the fact that chiral molecules on the surface of semiconductor nanomaterials break their inherent symmetry, i.e., the molecular chirality is transferred to the excitons and endows the hybridized optical activity [26-28]. In other words, the hybrid of chiral molecule-stabilized nanomaterials can be regarded as a gigantic artificial "molecule" with implanted chirality, which has no symmetrical plane/center due to the "chiral surface" [29-31].
For the general design principles behind chiral biosensing, fabrication of chiral nanostructures and corresponding structureproperty relationship, especially associated bio-applications, readers are encouraged to refer exceptional reviews summarized by Xu group, Kuang group, and etc. [8, 9, 11, 13, 32, 33]. In the current review, we aim to focus analytical methodologies in an analyteoriented approach, i.e., enantioselective analysis of chiral molecules, through noble metal and semiconductor nanomaterials. Many researchers have adopted chiral nanomaterials to detect and isolate the enantiomers of amino acids, DNA, RNA, toxins, proteins etc. In the following paragraphs, the employments of noble metal or semiconductor in those fields are classified by the applied techniques.
Noble metal nanomaterials have unique physical and chemical properties, leading to excellent prospects in enantioselective analysis. First, noble metal nanomaterials could be prepared facilely and stored stably for a long time. Second, noble metal nanomaterials have adjustable sizes, with size-dependent and unique photoelectric properties. Third, noble metal nanomaterials have very large specific surface area, to facilitate modifications on accessible sites. Fourth, noble metal nanomaterials have excellent biocompatibility [33]. The overlap of plasmonic near-fields between adjacent metallic nanoparticles induces a resonantly coherent oscillation of the free electrons, termed plasmon hybridization, is frequently adopted for designing, obtaining, and generating uniquely chiral optics [34-37]. Chiral structures with optical activities are routinely applied for chiral detections of biological molecules, organic molecules, disease biomarkers, and etc. (Table 1) [18, 38-82].
 DownLoad:
CSV
DownLoad:
CSV

|
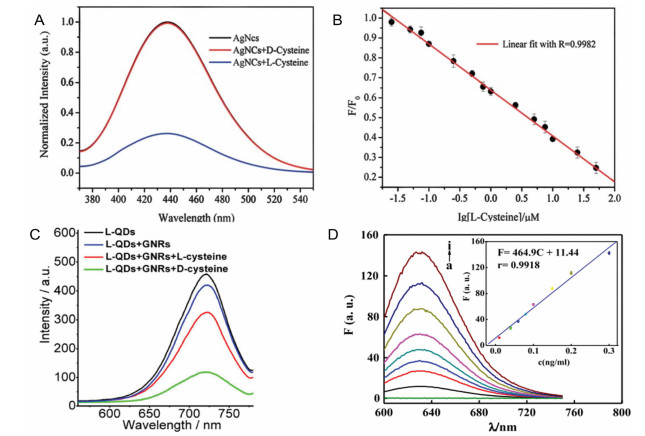
As mentioned above, the interactions between enantiomers and noble metal nanomaterials could influence the quantum yield and the peak position of fluorescence, accordingly, methodologies for chiral recognitions and detections were extensively explored [15, 16]. Ag NCs capped and reduced by L-glutathione were utilized for selective recognition of L-cysteine. During the detection process, the efficiency of electron transferred from Ag NCs to cysteine was divergent due to the different steric hindrance of chiral molecules. Since L-cysteine has lower steric hindrance than D-cysteine, only L-cysteine could lead to fluorescence quenching of Ag NCs, and the concentration of L-cysteine was linearly correlated with the degree of fluorescence quenching, in the range of 0.025–50 μmol/L (Figs. 2A and B) [18]. In another report, Xia group found that the assemblies between gold nanorods (NRs) and quantum dots (QDs) could be trigged by chiral cysteine, subsequently, the QDs rapidly donate the energy to the NRs. Both L/D-cysteine could lead to a fluorescence quenching, but L-cysteine induced a higher quenching efficiency (Fig. 2C). It was found that thiol group of cysteine was connected with GNR surface through robust binding affinity, and the amino and carboxyl group of cysteine could interact with cysteine on QDs surface. The lengths of the Lcysteine-L-cysteine dimers are 0.22 nm longer than D-cysteine-Lcysteine dimers. Therefore, longer distance of L-cysteine-L-cysteine dimers led to a weaker quenching efficiency. The fluorescence quenching of assemblies was applied to identify concentration and enantiomeric composition of cysteine, with a detection limit of 0.8 nmol/L demonstrated. Compared with probe through traditional organic dyes, the fluorophore in this study could emit at near-infrared range and had decent water solubility, also, broader potential in bio-chemical and medical applications [38]. Using a similar strategy, Chen et al. constructed Ag nanocrystals (NCs), which were functionalized by anti-ochratoxin A aptamer and magnetic beads, to quantitatively determine ochratoxin A in agricultural products (Fig. 2D). The linear dynamic range was 0.01–0.30 ng/mL, and the limit of detection (LOD) for ochratoxin A was 2 pg/mL [39].
The enantioselective analysis through colorimetry means does not need expensive or complex instruments, and the diagnose is timely, cheap, with simple operation and wide adoption [32]. Since the bonding between noble metal and chiral analytes could overcome the repulsive forces between nanomaterials, the dispersion and aggregation stages of noble metal nanomaterials were controlled by chiral analytes, at the same time, reflected in the change of color and absorption spectra [83]. As a result, the colorimetry-based analysis could distinguish the chirality and concentration of analytes.
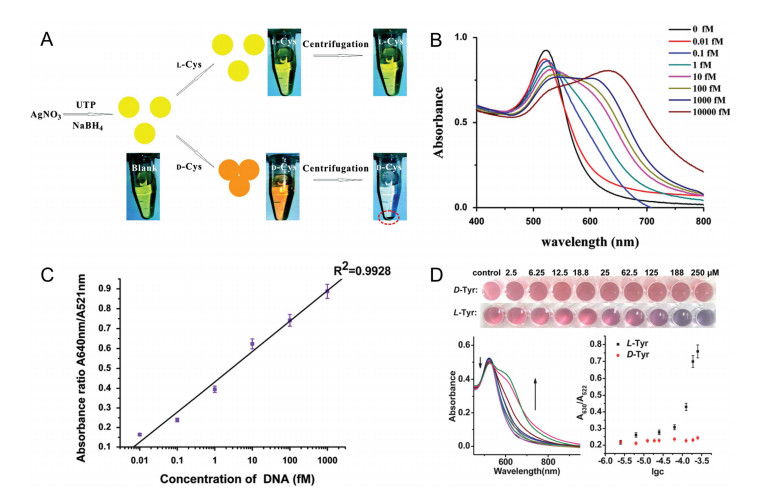
Ye group exploited a uridine 5'-triphosphate (UTP)-modified Ag nanoparticles (NPs) and observed the color change from yellow toward red, to determine the concentration of D-cysteine, but no obvious tinctorial variation existed with the addition of L-cysteine. It is worth noting that after the reaction between D-cysteine and UTP-capped Ag NPs, L-cysteine of racemic solution could be separated and enriched in solution by centrifugation treatment (Fig. 3A) [40]. More recently, gold nanoparticles modified with two disparate oligonucleotide probes had been designed to detect targeted DNA. Under the complementary of oligonucleotide probes, the ligation chain reaction allowed multiple targeted DNA to be conjugated with Au NPs, and exponentially amplified, achieving high-throughput determination of the concentration of the targeted DNA. As the concentration of targeted DNA increased, solution color turned from red to purple, which could be characterized by UV–vis spectra to analyze the concentration of targeted DNA, with a LOD of 1.5 amol/L in a linear dynamic range of 0.01–1000 fmol/L (Figs. 3B and C). Additionally, it could be identified by dynamic light scattering with a lower LOD of 0.1 amol/L, in a range of 0.01–10000 fmol/L [41]. Su et al. developed a colorimetric sensor for L-Tyrosine, based on N-acetyl-L-cysteine capped Au NPs. L-Tyrosine could induce aggregation of Au NPs through modulating inter-particle forces, subsequently, monitoring the color changes and absorption spectra led to the successful detection of L-tyrosine (Fig. 3D). L-Tyrosine could be recognized and enriched in the racemic solution through selective aggregation with Au NPs, then separated from solution via centrifugation; meanwhile, D-tyrosine was left in the supernatant [42]. Zor designed a transparent and colorimetric nanopaper composed by silver nanoparticles and utilized the color changes of colloids to obtain the concentration of D-cysteine, with an ultrasensitive detection limit of 4.88 μmol/L established. Considering the significant color changes from yellow to purple-brown resulted from interaction of chiral Ag NPs with D-cysteine, it could be designed as a nanopaper-based cuvette for rapid detection of D -cysteine, and the percentage of D-cysteine enantiomers could be determined by spectrophotometric assay [43].
Chiral noble metal nanomaterials had also been embraced for enantioselective analysis of a copious amount of chiral amino acids and drugs. Au NPs capped by prolinederivatives were developed as a chiral discrimination system for histidine, with color changes observed by naked eyes. In the presence of L-histidine, the system turnedblue, however, with the existence of D-histidine/rac-histidine, the colors were red/purple, respectively [44]. Another idea for the detection of D-histidine was based on the chirality of L-tartaric acid modified gold nanoparticles. The agglomeration of Au NPs could be induced by D-histidine, with a solution color change from red to blue, however, L-histidine could not initiate any change. The changes of absorption ratio (absorbance at 700 nm/absorbance at 520 nm) for Au NPs as a function of the concentration of D-histidine held a satisfactory linearity in the range of 0.02–2 mmol/L, with a detection limit of 0.015 mmol/L established [45]. The enantiometric excess of D-tryptophan in the range from -50% to 100% could be determined by citrate-capped silver nanoparticles by spectrophotometry. It could also be used for enantioselective separation of tryptophan [46]. An assay based on Au NRs was utilized as colorimetric probefor visual recognition of glutamine enantiomers. The aggregation of Au NRs could be rapidly induced by D-glutamine, with evident color switching from blue to gray, however, Lglutamine could not induce similar phenomena. This system could be used to determine the enantiometric excess of D-glutamine from -100% to100% [47]. In anothercase, agglomeration of citrate coated Au NPs was triggered by S-citalopram. The absorption peak of Au NPs at 520 nm was decreased, and new absorption peak appeared near 600–700 nm. The decreased absorbance at 520 nm was linearly dependent on the concentration of S-citalopram in the range of 2.5 ×10⁻⁶-6.0 ×10⁻⁴ mol/L, with a detection limit as low as 2.1 ×10⁻⁶ mol/L manifested [48]. In another paper, after the addition of silver nanoparticles to (RS)-citalopram solution, silver nanoparticles were agglomerated due to the interaction with Rcitalopram, and the solution color turned from yellow towards red. In this system, the colorimetric sensor could quantify the concentration of R-citalopram, with an established linear range of 7.6 ×10⁻⁹-1.7 ×10⁻⁴ mol/L and LOD of 3.0 ×10⁻⁹ mol/L [49]. Mandelic acid enantiomers could be detected by L-tartaric acidcapped goldnanoparticles. The colorchanges from redtoblue could be seenwhile L-mandelic acid was added to the Au NPs solution, but no color change was observed when D-mandelic acid was introduced. The enantiomer excess of L-mandelic acid could be acquired in the range of -100%-100% [50]. S-Naproxen was selectively identified from water and biological samples by N-acetyl-L-cysteine-capped Au NPs [51]. The enantioselectivity of Lalanine was realized by Au NPs-embedded in a paper-based lab-ina-syringe system. This lab-in-a-syringe could detect the L-alanine in human serum, and the detection results could be obtained within 5 min, with a detection limit of 0.77 mmol/L [52]. β-Cyclodextrin functionalized Ag NPs could be used to quantitatively determine the percentage of D-phenylalanine in D- and L-phenylalanine mixtures. In the presence of D-phenylalanine, Ag NPs aggregated, and obvious color changes from yellow to red could be observed. Meanwhile, in the UV–vis absorption spectrum, the absorbance decreased at 395 nm and a new absorption peak appeared at 530 nm.However, in the presence of L-phenylalanine, Ag NPs were monodispersed, the spectrum remained almost constant and no color changes were observed. Thus, the color and absorption spectra of β-cyclodextrin functionalized AgNPssolution allowedthe differentiation between D-phenylalanine and L-phenylalanine [53]. An android smartphone application for sensitive and fast detection of ibuprofen enantiomers was developed. Aptamer-capped gold nanoparticles could be accumulated by binding with enantiomer of ibuprofen. After optimization, the limits of detection for S-ibuprofen and R-ibuprofen were 1.24 and 3.91 pg/mL, respectively [54].
The noble metal nanomaterials exhibit strong SPR-derived properties, a strong chiral signal could emerge at the SPR peak position after appropriate modifications, which have promoted corresponding analysis through CD [84, 85]. There are various sensing platforms readily developed to detect numerous chiral targets, including tumor cells [55, 86], DNA [56, 57], microRNA [66], biomarkers of clinic diseases [58-60], amino acid enantiomers [61, 62], etc.
The noble metal nanorods (NRs) were assembled and applied to detect chiral enantiomers by CD. Without chiral molecules, the end-to-end assemblies of Au NRs had no circular dichroic signal. In the presence of enantiomeric cysteines, Au NPs were assembled as dimers, and the chiroptical activity was produced in the visible wavelength area. Thus, it could achieve the purpose of chiral recognition and quantification, and the detection limit of L-cysteine was 20 pmol/L [63]. Similarly, antibody-antigen bridged Au NPs and Ag NPs heterodimers could realize the detection of DNA markers with LOD of 3.7 amol/L [64]. Heterodimers of Au@Ag NPs had ultrasensitive quantification for detection of an environmental toxin, microcystin-LR, and a cancer biomarker, prostate-specific antigen. It exploited the cooperative interaction between chiral analytes and atoms on NPs surfaces to amplify the CD signal, with 0.076 amol/L LOD of prostate-specific antigen in the linear range of 0.1–50 amol/L demonstrated [65]. Li et al. fabricated a microRNA-based CD sensing platform, through a gold nanoparticle-upconversion pyramids, and achieved eminent LOD of 0.03 fmol per 10 μg, with a linear range of 0.073–43.65 fmol per 10 μg (Figs. 4A and B) [66]. Ma et al. developed the side-by-side Au NRs assemblies, to realize possible detection of DNA markers by taking advantage of the strong polarization rotation from the assemblies. The system had powerful sensitivity for the analysis of biomolecules larger than 2 nm, resulting from enhancement of polarization rotation by side-by-side assemblies, with the limit of detection for DNA markers as low as 3.7 amol/L manifested [67]. End-to-end assemblies of plasmonic Au NRs for enantioselective recognition of cysteine and glutathione was designed by Zhu et al., the limit of detection for cysteine and glutathione could reach micromolar concentrations scale (Fig. 4C) [68].
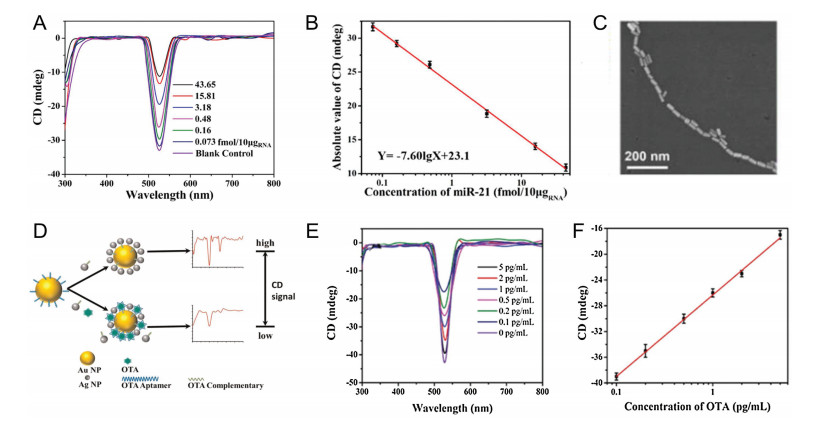
Another particularly interesting idea was the employment of noble metal NPs core–satellite superstructure to detect chiral enantiomers. Recently, a DNA-based, self-assembled core–satellite superstructure was applied as a chiral biosensor to achieve quantitative detection of ochratoxin A. OTA aptamer modified-Au NPs and OTA complementarily functionalized-Ag NPs were hybridized to form Au core–Ag NP satellite assemblies. But when ochratoxin A was present, the Au NPs could be separated from core–satellite structure, then conjugated to ochratoxin A, and the CD signal was reduced. Accordingly, the intensity of the CD signal depended on the concentration of ochratoxin A. This method was highly sensitive, specific, and had a low LOD as 0.16 pg/mL in the linear range of 1–50 pg/mL (Fig. 4D) [69]. In a similar way, Cai et al. designed DNA-based Ag@Au nanoparticle satellite assemblies for ochratoxin A detection, with an outstanding linear range from 0.1 to 5 pg/mL for ochratoxin A and a detection limit of 0.037 pg/mL (Figs. 4E and F) [70].
Single noble metal NPs could also be used as chiral probes for recognition and quantification of enantiomers. Li group reported a method for the specifically recognition of DOPA enantiomers. LDOPA could induce a red-to-blue color change in L-cysteine capped Au NPs solution, whereas D-DOPA could not trigger similar phenomena [71]. Also using single Au NPs, the same group distinguished D- and L-tryptophan (Trp). The color changes from red to blue could be observed, after the addition of D-Trp to the Au NPs solution, while no color change was found in the case of L-Try. Using this strategy, it was possible to quantify concentration of DTrp in a linear dynamic range of 0.2–10 μmol/L, with a detection limit down to 0.1 μmol/L [72]. Liu group developed the penicillamine-stabilized chiral Au-Ag alloy NPs, and then used them as a CD probe toward D- and L-penicillamine enantiomers. The LOD for Lpenicillamine and D-penicillamine was 1.7 μmol/L and 1.5 μmol/L, respectively, with a linear range of 5.0–80.0 μmol/L [73]. And Gellman group found that (R)-propylene oxide (or (S)-propylene oxide) were specifically adsorbed toward L-cysteine (or D-cysteine) capped Au NPs [74]. Yang et al. devised penicillamine modified Au NCs to image HeLa cell, with excellent cellular compatibility [86]. Kuang group manufactured two devices self-assembled by NPs pyramids, and used the rapid chiral link with DNA to achieve a low LOD as 3.4 amol/L [56]. Zhao et al. reported a DNA detection method based on gold and silver core-shell heterodimer, with LOD on zeptomolar scale demonstrated [57]. Another example used plasmonic electronic oscillations of Ag@Au NPs assemblies to efficiently capture the HER2 signal of circulating tumor cells and improve the detection accuracy [55]. Besides, assemblies of nanoparticles for diagnosis of diseases in living cells had received abundant attention. For epithelial cell-adhesion molecule, the LOD was as low as 3.63 pg/mL [58], for amyloid fibrils of Parkinson's disease, the LOD was down to nanomolar [59], and for β-structured amyloid plaque (a useful marker for Alzheimer's, Parkinson's and the transmissible spongiform encephalopathies) was around nanogram scale [60]. And cysteine could be detected by mesoporous silica coated Ag nanoparticles [61]. Detection of phenylalanine utilized chirality and electric field enhancement of gold NPs gammadions [62].
In addition to the aforementioned approaches, there are other signal enhancement methodologies based on noble metal nanomaterials to recognize enantiomers, such as laser desorption/ ionization mass spectrometry [75], electrochemical analysis [76-80], surface-enhanced Raman scattering [79]. Tseng et al. took gold supramolecules capped by chiral cysteine as surface-assisted laser desorption/ionization mass spectrometry (LDI-MS), which could selectively trap L-carnitine and D-carnitine, to enhance mass spectrometry signal intensities of the carnitine. Due to the Dcarnitine/D-cysteine and L-carnitine/L-cysteine could form a stronger electrostatic interaction, chiral gold supramolecules could provide excellent analyte substrate and promote the enrichment of a specific enantiomer for highly reproducible and sensitive detection in LDI-MS. The linear detection range was from 1 μmol/L to 10 μmol/L, and the limit of detection for each carnitine enantiomer was 500 nmol/L [75]. Ma et al. studied asymmetric electrocatalytic selectivity of chiral Ag films and utilized oxidation current in this method to differentiate L/Dalanine. Chiral electrochemical behaviors of alanine enantiomer were completely divergent in Ag films with opposite chirality. Due to the electrochemically active sites of the chiral Ag film, specific adsorption and electron transfer reactions proceeded preferentially on chiral alanine molecule, for example, on the R-Ag film electrode, D-alanine exhibited a stronger oxidation current, and Lalanine displayed a higher oxidation current on the S-Ag film electrode [76]. Electrochemical detection could be applied for the detection of tryptophan isomer through Au@Ag NPs, with LOD of 1.21 pmol/L for D-tryptophan [78]. Afkhami et al. developed modified electrodes with stereoselectivity for S-naproxen, and a LOD of 6.7 × 10⁻⁷ mol/L was demonstrated [77]. Coating silver shell on the surface of Au NR dimer significantly enhanced the electronic field, as a result, Au@Ag NR dimer was an ideal matrix for constructing SERS substrate with significant Raman enhancement effect, a detection limit of 0.006 pmol/L and a wide linear range of 0.01–10 pmol/L for the detection of dopamine were obtained [79]. Recently, Zhang et al. fabricated a self-assembled core satellite gold nanoparticle networks, and utilized the normalized change of tunneling current in this platform to differentiate L/D-carnitine, with an impressive and extremely sensitive LOD down to picomolar scale demonstrated [80].
There are plentiful of theoretical researches on chiral semiconductors, with numerous applications demonstrated at the same time (Table 2) [87-102]. Due to the outstanding optical properties from chiral semiconductor nanomaterials, such as wide absorption range, narrow emission peak, high quantum yield, and superb optical stability, extensive attentions were gained in corresponding analysis to differentiate enantiomers. Generally, chiral sensors based on semiconductors could be fabricated in two steps. First, chiral semiconductor nanomaterials were obtained by coating chiral molecules onto the surface. Then, chiral analytes selectively bonded to the chiral semiconductor nanomaterials, at the same time, optical change could be detected [87]. It is worth mentioning that, compared to noble metals, the colorimetry-based enantioselective analysis through semiconductor nanomaterials is still a virgin land waiting to be explored, and we focused our topics on the already demonstrated cases.
The fluorescence of semiconductor is associated with electron–hole pairs of semiconductors. In chiral fluorescent analysis, chiral analyte could influence the electron hole ecombination of chiral nanomaterials to quantitate enantiomer concentration.
Simonet group developed the selective recognition in chiral analysis through fluorescence. Carnitine enantiomers were selected and identified by CdSe(ZnS) QDs modified by L-cysteine or D-cysteine. D-Carnitine significantly reduced the fluorescence intensity of L-cysteine terminated QDs, however, L-carnitine could not trigger similar phenomena. On the other hand, the fluorescence of D-cysteine terminated QD was only affected by Lcarnitine (Fig. 5A) [87]. Ghasemi et al. used thioglycolic acidcapped CdTe QDs to detect cysteine. The hydrogen bonding between the thiolacetic acid-capped CdTe QDs and the chiral cysteine resulted in the aggregation of QDs, and the color of the solution changed. In basic media, D-cysteine caused the color of CdTe QDs solution changing from green to yellow, while L-cysteine had no such color change for a long time. The system was able to determine the enantiomeric excess of D-cysteine in the range of -100%–100% [88]. Similar scheme was designed to sense cysteine by penicillamine capped CdS QDs, with LOD of 0.07 mmol/L demonstrated [89].
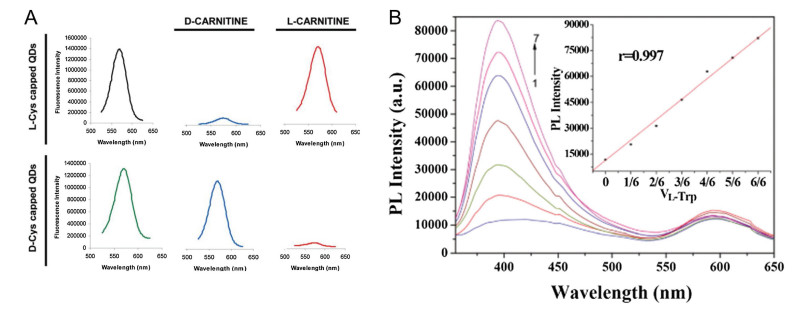
In a typical example by Li group, chiral tyrosine (Tyr) was identified by fluorescent probes, i.e., β-cyclodextrins-CdSe/ZnS QDs. Since the surface of QDs was coated with β-cyclodextrins, the semiconductor nanoparticles were stable in water, which enlarged the application horizon of the QDs. While L-tyr and β-cyclodextrins-CdSe/ZnS QDs reacted, the fluorescence was observed to be enhanced by 71%, which was 7.09 times of the fluorescence intensity of D-tyr. Similar to β-cyclodextrins-CdSe/ZnS QDs, α-cyclodextrins-CdSe/ZnS QDs could also enantioselectively recognize D-tyr. There was a good linear relation between the concentration of enantiomer and fluorescence intensity [90]. Similarly, Wei et al. developed a photoluminescence based chiralassay for tryptophan enantiomers detection, through β-cyclodextrin capped Mn-doped ZnS quantum dots. The fluorescence intensity of β-cyclodextrin capped Mn-doped ZnS quantum dots showed disparate responses to tryptophan enantiomers: D-Isomer showed weak response, while L-tryptophan showed stronger signal response in PL intensity of QD. L-Iryptophan could be diagnosed in the presence of D-tryptophan, with a LOD of 5.4 nmol/L demonstrated (Fig. 5B) [91]. In another β-cyclodextrin-CdSe/ZnS QDs based assay, Willner group used it for the chiroselective optical discrimination between D/L-phenylalanine and D/ L-tyrosine. L-Tryptophan significantly enhanced the PL strength of β-cyclodextrin-Mn-ZnS QDs, while D-tryptophan hardly affected it. The QDs had excellent physicochemical stability over several weeks [92]. Recently, Ríos group differentiated L-penicillamine and D-penicillamine by β-cyclodextrin-CdSe/ZnS QDs. The detection ranges of L-penicillamine and D-penicillamine were 0.8–5.0 mg/L and 0.1–5.0 mg/L, and the detection limits were 0.2 mg/L and 0.06 mg/L, respectively [93]. Chiral CdSe/CdS QDs could be used to detect chiral CoFe2O4 magnetic nanoparticles. The surface of both QDs and magnetic nanoparticles was stabilized with cysteine molecules. It was found that nanoparticles stabilized with complementary enantiomers interacted more effectively than those with the same enantiomeric ligand, so quenching was more obvious for those nanoparticles [94].
Yang group proposed a new method for chiral recognition of phenylglycine enantiomers. When Ag+ was present in the reaction system, phenylglycine enantiomers induced the N-acetyl-L-cysteine-capped CdTe quantum dots to produce different fluorescence signals, among which the fluorescence of S-phenylglycine + Ag++QDs system were markedly enhanced, while that of Rphenylglycine + Ag++QDs system were significantly decreased. The increase and decrease of fluorescence intensity were proportional to the concentrations of S-phenylglycine and R-phenylglycine, and the linear range was 10-5-10-7 mol/L. The detection limit of the scheme was 10-7 mol/L, and the correlation coefficients of Sphenylglycine and R-phenylglycine were 0.995 and 0.980, respectively[95].Chiral fluorescent analysis could also be applied to detect the fluorescent of ochratoxin A [96], aryl propionic acids, ketoprofen, naproxen [97], flurbiprofen, and ibuprofen [98].
The CD signals are sensitive to the interaction between the highest occupied molecular orbital (HOMO) of the surface ligands and the generated hole of the NPs [103-105]. Ngeontae group proposed a circular dichroic sensor based on CdS QDs for chiral identification and detection of penicillamine. The CD signals of chiral penicillamine molecules had low signal-to-noise ratio, and the trace detection was not accurate enough. However, the CD signals of D-penicillamine and L-penicillamine could be enhanced in the presence of achiral CdS QDs capped by racemic cysteine. After the signal amplification of achiral CdS QDs, the CD signals of D-penicillamine and L-penicillamine showed a linear relationship with the concentrations of the two enantiomers, ranging from 1 mmol/L to 35 mmol/L. The detection limits of DPA and LPA were 0.49 mmol/L and 0.74 mmol/L, respectively [99].
Besides the fluorescence and CD-based methods, there are other detection schemes and mechanisms, such as photoinduced cutting of DNA [100], chemiluminescence [101], Rayleigh scattering [102]. Sun et al. reported that cysteine-modified CdTe NPs could specifically recognize and cut at the DNA restriction site, after polarized light excitation in double-stranded DNA with more than 90 base pairs. Interestingly, D-cysteine-CdTe NPs had a faster cleavage rate under LCP than under RCP, while L-cysteine-CdTe NPs had a faster cleavage rate under RCP. It could promote design of abiotic materials for gene editing and other biological applications, due to the high efficiency and bio-stability of D-cysteine-CdTe NPs [100]. According to the different chemiluminescence intensity generated by the interaction between CdTe QDs and penicillamine or cysteine isomers, those enantiomers could be effectively identified. The peak intensities of chemiluminescence from Lpenicillamine and D-penicillamine were different, with the peak intensity of L-penicillamine much lower than that of D-penicillamine. The contrasting signals of the two enantiomers showed that the determination of chemiluminescence based on QDs could distinguish penicillamine enantiomers, with satisfactory detection range of 1.15–9.2 nmol/L for penicillamine [101]. Resonance Rayleigh scattering (RRS) of N-acetyl-L-cysteine-CdTe QDs modified by Cu2+ was quenched by phenylalanine enantiomers. In the presence of D/L-phenylalanine, aggregation of CdTe QDs generated scattering. Compared with L-phenylalanine, the quenching degree of RRS of D-phenylalanine was more significant, due to the combination between QDs and D-phenylalanine was stronger. The relative intensity of RRS exhibited a linear relationship with the concentration of D-phenylalanine, ranging from 4 mg/mL to 80 μg/mL [102].
The applications of noble metal and semiconductor nanomaterials to detect chiral molecules has been a central focus of recentefforts, due to the value of pure enantiomeric compounds and drugs in the fields of biological sciences, clinical medicine and bionics. Although the field of chiral noble metal and semiconductor nanomaterials has made considerable progress in recent years, it is still in its infancy. The basic mechanism and potential applications of chiral nanomaterials need to be further investigated experimentally and theoretically, to further expand potential applications scenes. In addition, future interests in the field could be motivated, at least partly, by the realization of following viewpoints. First, preparation of chiral noble metal and semiconductor nanomaterials is still relatively complex and requires a lot of time. There is still room to improve and simplify the synthesis protocols. Second, the chiral signal is too weak to be detected in some biological applications, although it had been enhanced significantly. Higher amplification of the chiral signal is demanded to enhance the sensitivity and enantioselectivity. Finally, some detection techniques are limited to organic solvents. This limits the application of those sensors in the detection of water-soluble chiral analytes and chiral recognition in physiological environment. In conclusion, the applications of noble metal and semiconductor nanomaterials in enantioselective analysis have aroused significant interest due to corresponding novel properties and potential, and we can expect the field to evolve rapidly in the future.
The work was supported by the National Natural Science Foundation of China (Nos. 21605044 and 51872085), Joint NSFC-ISF Research (No. 21761142009), and Hunan Provincial Natural Science Foundation of China (No. 2019JJ20003).
L.A. Nguyen, H. He, C. Phamhuy, Int. J. Biomed. Sci. 2(2006) 85-100.
K. Stoschitzky, G. Zernig, W. Lindner, J. Clin. Bas. Cardiol. 1(1998) 14-18.
A.M. Barrett, V.A. Cullum, Br. J. Pharmacol. 34(1968) 43-55. doi: 10.1111/j.1476-5381.1968.tb07949.x
K.H. Rahn, A. Hawlina, F. Kersting, et al., Naunyn-Schmiedeberg's Arch. Pharmacol. 286(1974) 319-323. doi: 10.1007/BF00498314
M.F. Landoni, A. Soraci, Curr. Drug Metab. 2(2001) 37-51. doi: 10.2174/1389200013338810
A. Marzo, E. Heftmann, J. Biochem. Biophys. Methods 54(2002) 57-70. doi: 10.1016/S0165-022X(02)00128-8
J.L. Flanagan, P.A. Simmons, J. Vehige, et al., Nutr. Metab. 7(2010) 30. doi: 10.1186/1743-7075-7-30
W. Ma, L.G. Xu, L.B. Wang, et al., Adv. Funct. Mater. 29(2019)1805512. doi: 10.1002/adfm.201805512
C. Hao, L. Xu, H. Kuang, et al., Adv. Mater. (2019), doi:http://dx.doi.org/ 10.1002/adma.201802075.
J. Kumar, L.M. Liz-Marzan, Bull. Chem. Soc. Jpn. 92(2019) 30-37. doi: 10.1246/bcsj.20180236
S.Z. Bisri, C. Piliego, J. Gao, et al., Adv. Mater. 26(2014) 1176-1199. doi: 10.1002/adma.201304280
W. Ma, L.G. Xu, L.B. Wang, et al., Biosens. Bioelectron. 79(2016) 220-236. doi: 10.1016/j.bios.2015.12.021
X. Zhang, J. Yin, J. Yoon, Chem. Rev. 114(2014) 4918-4959. doi: 10.1021/cr400568b
E. Boisselier, D. Astruc, Chem. Soc. Rev. 38(2009) 1759-1782. doi: 10.1039/b806051g
G.W. Lu, L. Hou, T.Y. Zhang, et al., J. Phys. Chem. C 116(2012) 25509-25516. doi: 10.1021/jp309450b
E.M. Goldys, M.A. Sobhan, Adv. Funct. Mater. 22(2012) 1906-1913. doi: 10.1002/adfm.201102057
G.T. Boyd, Z.H. Yu, Y.R. Shen, Phys. Rev. B 33(1986) 7923-7936. doi: 10.1103/PhysRevB.33.7923
T. Liu, Y.Y. Su, H.J. Song, et al., Analyst 138(2013) 6558-6564. doi: 10.1039/c3an01343j
J. Fu, Z. Zhang, G. Li, Chin. Chem. Lett. 30(2019) 285-291. doi: 10.1016/j.cclet.2018.10.031
C. Gautier, T. Burgi, ChemPhysChem 10(2009) 483-492. doi: 10.1002/cphc.200800709
K.H. Su, Q.H. Wei, et al., Nano Lett. 3(2003) 1087-1090. doi: 10.1021/nl034197f
G. Gao, Y.W. Jiang, W. Sun, et al., Chin. Chem. Lett. 29(2018) 1475-1485. doi: 10.1016/j.cclet.2018.07.004
C.D. Medley, J.E. Smith, Z. Tang, et al., Anal. Chem. 80(2008) 1067-1072. doi: 10.1021/ac702037y
A.O. Govorov, Z. Fan, P. Hernandez, et al., Nano Lett. 10(2010) 1374-1382. doi: 10.1021/nl100010v
I. Lieberman, G. Shemer, T. Fried, et al., Angew. Chem. Int. Ed. 47(2008) 4855-4857. doi: 10.1002/anie.200800231
M. Puri, V. Ferry, ACS Nano 255(2018) 12240-12246.
F. Purcell-Milton, R. McKenna, L.J. Brennan, et al., ACS Nano 12(2018) 954-964. doi: 10.1021/acsnano.7b06691
G.L. Yang, M. Kazes, D. Oron, Adv. Funct. Mater. 28(2018) 1802012. doi: 10.1002/adfm.201802012
X. Gao, X. Zhang, K. Deng, et al., J. Am. Chem. Soc. 139(2017) 8734-8739. doi: 10.1021/jacs.7b04224
J.K. Choi, B.E. Haynie, U. Tohgha, et al., ACS Nano 10(2016) 3809-3815. doi: 10.1021/acsnano.6b00567
M.V. Mukhina, V.G. Maslov, A.V. Baranov, et al., Nano Lett. 15(2015) 2844-2851. doi: 10.1021/nl504439w
Y.J. Song, W.L. Wei, X.G. Qu, Adv. Mater. 23(2011) 4215-4236. doi: 10.1002/adma.201101853
K. Saha, S.S. Agasti, C. Kim, et al., Chem. Rev. 112(2012) 2739-2779. doi: 10.1021/cr2001178
J.R. Mejia-Salazar, O.N. Oliveira, Chem. Rev. 118(2018) 10617-10625. doi: 10.1021/acs.chemrev.8b00359
W. Ma, H. Kuang, L. Wang, et al., Sci. Rep. 3(2013) 1934. doi: 10.1038/srep01934
C.Y. Song, M.G. Blaber, G.P. Zhao, et al., Nano Lett. 13(2013) 3256-3261. doi: 10.1021/nl4013776
L.Y. Wang, K.W. Smith, S. Dominguez-Medina, et al., ACS Photonics 2(2015) 1602-1610. doi: 10.1021/acsphotonics.5b00395
L. Song, S.F. Wang, N.A. Kotov, et al., Anal. Chem. 84(2012) 7330-7335. doi: 10.1021/ac300437v
J.H. Chen, X. Zhang, S.X. Cai, et al., Biosens. Bioelectron. 57(2014) 226-231. doi: 10.1016/j.bios.2014.02.001
M. Zhang, B.C. Ye, Anal. Chem. 83(2011) 1504-1509. doi: 10.1021/ac102922f
H.H. Yin, X. Huang, W. Ma, et al., Biosens. Bioelectron. 52(2014) 8-12. doi: 10.1016/j.bios.2013.07.064
H.Y. Su, Q.L. Zheng, H.B. Li, J. Mater. Chem. 22(2012) 6546-6548. doi: 10.1039/c2jm16746h
E. Zor, Talanta 184(2018) 149-155. doi: 10.1016/j.talanta.2018.02.096
S.H. Seo, S. Kim, M.S. Han, Anal. Methods 6(2014) 73-76. doi: 10.1039/C3AY41735B
G.X. Song, F.L. Zhou, C.L. Xu, et al., Analyst 141(2016) 1257-1265. doi: 10.1039/C5AN02434J
C.W. Liu, B.X. Li, C.L. Xu, Microchim. Acta 181(2014) 1407-1413. doi: 10.1007/s00604-014-1281-y
Y.W. Wang, X.J. Zhou, C.L. Xu, et al., Sci. Rep. 8(2018) 5296. doi: 10.1038/s41598-018-23674-y
J. Tashkhourian, M. Afsharinejad, A.R. Zolghadr, Sens. Actuators B-Chem. 232(2016) 52-59. doi: 10.1016/j.snb.2016.03.097
J. Tashkhourian, M. Afsharinejad, New J. Chem. 41(2017) 13881-13888. doi: 10.1039/C7NJ02962D
G.X. Song, C.L. Xu, B.X. Li, Sens. Actuators B-Chem. 215(2015) 504-509. doi: 10.1016/j.snb.2015.03.109
I. Boussouar, Q.J. Chen, X. Chen, et al., Anal. Chem. 89(2017) 1110-1116. doi: 10.1021/acs.analchem.6b02682
E. Zor, N. Bekar, Biosens. Bioelectron. 91(2017) 211-216. doi: 10.1016/j.bios.2016.12.031
C.W. Liu, J.Y. Lian, Q. Liu, et al., Anal. Methods 8(2016) 5794-5800. doi: 10.1039/C6AY01308B
J. Ping, Z.J. He, J.S. Liu, et al., Electrophoresis 39(2018) 486-495. doi: 10.1002/elps.201700372
Y. Zhao, Y.X. Yang, J. Zhao, et al., Adv. Mater. 28(2016) 4877-4883. doi: 10.1002/adma.201600369
W.J. Yan, L.G. Xu, W. Ma, et al., Small 10(2014) 4293-4297.
Y. Zhao, L.G. Xu, W. Ma, et al., Nano Lett. 14(2014) 3908-3913. doi: 10.1021/nl501166m
W. Ma, M.Z. Sun, P. Fu, et al., Adv. Mater. 29(2017) 1703410. doi: 10.1002/adma.201703410
J. Kumar, H. Erana, E. Lopez-Martinez, et al., Proc. Natl. Acad. Sci. U. S. A. 115(2018) 3225-3230. doi: 10.1073/pnas.1721690115
E. Hendry, T. Carpy, J. Johnston, et al., Nat. Nanotechnol. 5(2010) 783-787. doi: 10.1038/nnano.2010.209
J. Garcia-Guirado, M. Svedendahl, J. Puigdollers, et al., Nano Lett. 18(2018) 6279-6285. doi: 10.1021/acs.nanolett.8b02433
J. Wang, S.S. Zhang, X. Xu, et al., Nanomaterials 8(2018)1703410.
L.G. Xu, Z. Xu, W. Ma, et al., J. Mater. Chem. B 1(2013) 4478-4483. doi: 10.1039/c3tb20692k
X.L. Wu, L.G. Xu, L.Q. Liu, et al., J. Am. Chem. Soc. 135(2013) 18629-18636. doi: 10.1021/ja4095445
L.J. Tang, S. Li, L.G. Xu, et al., ACS Appl. Mater. Interfaces 7(2015) 12708-12712. doi: 10.1021/acsami.5b01259
S. Li, L.G. Xu, W. Ma, et al., J. Am. Chem. Soc. 138(2016) 306-312. doi: 10.1021/jacs.5b10309
W. Ma, H. Kuang, L.G. Xu, et al., Nat. Commun. 4(2013) 2689. doi: 10.1038/ncomms3689
F. Zhu, X.Y. Li, Y.C. Li, et al., Anal. Chem. 87(2015) 357-361. doi: 10.1021/ac504017f
X.L. Zhao, X.L. Wu, L.G. Xu, et al., Biosens. Bioelectron. 66(2015) 554-558. doi: 10.1016/j.bios.2014.12.021
J.R. Cai, C.L. Hao, M.Z. Sun, et al., Small 14(2018) 1703931. doi: 10.1002/smll.201703931
L. Zhang, C.L. Xu, G.X. Song, et al., RSC Adv. 5(2015) 27003-27008. doi: 10.1039/C5RA01271F
L. Zhang, C.L. Xu, C.W. Liu, et al., Anal. Chim. Acta 809(2014) 123-127. doi: 10.1016/j.aca.2013.11.043
J.J. Wei, Y.J. Guo, J.Z. Li, et al., Anal. Chem. 89(2017) 9781-9787. doi: 10.1021/acs.analchem.7b01723
N. Shukla, M.A. Bartel, A.J. Gellman, J. Am. Chem. Soc. 132(2010) 8575-8580. doi: 10.1021/ja908219h
Y.T. Tseng, H.Y. Chang, S.G. Harroun, et al., Anal. Chem. 90(2018) 7283-7291. doi: 10.1021/acs.analchem.8b00490
L. Ma, Y. Cao, Y. Duan, et al., Angew. Chem. Int. Ed. 56(2017) 8657-8662. doi: 10.1002/anie.201701994
A. Afkhami, F. Kafrashi, M. Ahmadi, et al., RSC Adv. 5(2015) 58609-58615. doi: 10.1039/C5RA07396K
Y. Zhao, L.Y. Cui, W. Ke, et al., ACS Sustain. Chem. Eng. 7(2019) 5157-5166. doi: 10.1021/acssuschemeng.8b06040
L.J. Tang, S. Li, F. Han, et al., Biosens. Bioelectron. 71(2015) 7-12. doi: 10.1016/j.bios.2015.04.013
Y.C. Zhang, J.Q. Liu, D. Li, et al., ACS Nano 10(2016) 5096-5103. doi: 10.1021/acsnano.6b00216
S. Basu, A. Paul, A. Chattopadhyay, Chem. Eur. J. 23(2017) 9137-9143. doi: 10.1002/chem.201701128
A. Guerrero-Martinez, J.L. Alonso-Gomez, B. Auguie, et al., Nano Today 6(2011) 381-400. doi: 10.1016/j.nantod.2011.06.003
W. Zhao, M.A. Brook, Y.F. Li, ChemBioChem 9(2008) 2363-2371. doi: 10.1002/cbic.200800282
A.O. Govorov, Z.Y. Fan, P. Hernandez, et al., Nano Lett. 10(2010) 1374-1382. doi: 10.1021/nl100010v
X. Wang, Z. Tang, Small 13(2017) 1601115. doi: 10.1002/smll.201601115
X. Yang, L.F. Gan, L. Han, et al., Chem. Commun. 49(2013) 2302-2304. doi: 10.1039/c3cc00200d
C. Carrillo-Carrion, S. Cardenas, B.M. Simonet, et al., Anal. Chem. 81(2009) 4730-4733. doi: 10.1021/ac900034h
F. Ghasemi, M.R. Hormozi-Nezhad, M. Mahmoudi, Sci. Rep. 7(2017) 890. doi: 10.1038/s41598-017-00983-2
K. Ngamdee, S. Kulchat, T. Tuntulani, et al., J. Lumin. 187(2017) 260-268. doi: 10.1016/j.jlumin.2017.03.016
C. Han, H. Li, Small 4(2008) 1344-1350. doi: 10.1002/smll.200701221
Y. Wei, H. Li, H. Hao, et al., Polym. Chem. 6(2015) 591-598. doi: 10.1039/C4PY00618F
R. Freeman, T. Finder, L. Bahshi, et al., Nano Lett. 9(2009) 2073-2076. doi: 10.1021/nl900470p
G.M.Duran, C.Abellan, A.M.Contento, et al., Microchim.Acta184(2017)815-824. doi: 10.1007/s00604-017-2074-x
A.K. Visheratina, F. Purcell-Milton, R. Serrano-Garcia, et al., J. Mater. Chem. C 5(2017) 1692-1698. doi: 10.1039/C6TC04808K
Y. Guo, X. Zeng, H. Yuan, et al., Spectroc. Acta Pt. A-Molec. Biomolec. Spectr. 183(2017) 23-29. doi: 10.1016/j.saa.2017.04.014
C. Wang, J. Qian, K. Wang, et al., Biosens. Bioelectron. 68(2015) 783-790. doi: 10.1016/j.bios.2015.02.008
D. Wawrzynczyk, J. Szeremeta, M. Samoc, et al., Sens. Actuators B-Chem. 252(2017) 483-491. doi: 10.1016/j.snb.2017.06.029
T. Delgado-Perez, L.M. Bouchet, M. de la Guardia, et al., Chem.-Eur. J.19(2013) 11068-11076. doi: 10.1002/chem.201300875
K. Ngamdee, T. Puangmali, T. Tuntulani, et al., Anal. Chim. Acta 898(2015) 93-100. doi: 10.1016/j.aca.2015.09.038
M. Sun, L. Xu, A. Qu, et al., Nat. Chem. 10(2018) 821-830. doi: 10.1038/s41557-018-0083-y
M. Shahrajabian, F. Ghasemi, M.R. Hormozi-Nezhad, Sci. Rep. 8(2018) 14011. doi: 10.1038/s41598-018-32416-z
J.D. Yang, X.P. Tan, X.N. Zhang, et al., Spectroc. Acta Pt. A-Molec. Biomolec. Spectr. 151(2015) 591-597. doi: 10.1016/j.saa.2015.07.012
Y. Li, Y.Z. Zheng, D.K. Zhang, et al., Chin. Chem. Lett. 28(2017) 184-188. doi: 10.1016/j.cclet.2016.07.020
W. Feng, J.Y. Kim, X. Wang, et al., Sci. Adv. 3(2017) e1601159. doi: 10.1126/sciadv.1601159
A. Ben Moshe, D. Szwarcman, G. Markovich, ACS Nano 5(2011) 9034-9043. doi: 10.1021/nn203234b

Figure 2 The fluorescence-based enantioselective analysis through noble metal nanomaterials. (A) The fluorescence spectra of Ag NCs before and after addition of L-cysteine or D-cysteine. (B) Linear plots of L-cysteine concentrations. Reproduced with permission [18]. Copyright 2013, The Royal Society of Chemistry. (C) The fluorescence spectra of LQDs, GNRs, and L-/D-cysteine. Reproduced with permission [38]. Copyright 2012, American Chemical Society. (D) Fluorescence spectra of the aptasensor with different concentrations of OTA (from a to i): 0.00, 0.01, 0.04, 0.06, 0.08, 0.10, 0.15, 0.20, and 0.30 ng/mL. Inset: A calibration curve demonstrating peak fluorescence intensity versus OTA concentration. Reproduced with permission [39]. Copyright 2014, Elsevier B.V.

Figure 3 The colorimetry-based enantioselective analysis through noble metal nanomaterials. (A) Absorption discrimination of L- and D-cysteine using UTP-capped Ag NPs. Reproduced with permission [40]. Copyright 2011, American Chemical Society. (B) Absorption spectra and (C) the linear relationship of Au NPs assembly in different concentrations of target DNA. Reproduced with permission [41]. Copyright 2013, Elsevier Ltd. (D) The obvious difference of N-acetyl-L-cysteine capped Au NPs after adding DTyr and L-Tyr. Reproduced with permission [42]. Copyright 2012, Royal Society of Chemistry.

Figure 4 The CD-based enantioselective analysis through noble metal nanomaterials. (A) CD spectra with different amounts of miR-21. (B) CD (521 nm) versus the different concentrations of intracellular miR-21. Reproduced with permission [66]. Copyright 2015, American Chemical Society. (C) SEM image of end-to-end assembly Au nanorods after addition of L-cysteine. Reproduced with permission [68]. Copyright 2014, American Chemical Society. (D) Scheme of chiral-aptasensor for the detection of OTA based on Au core-Ag nanoparticle satellite assemblies. Reproduced with permission [69]. Copyright 2015, Elsevier Ltd. (E) CD spectra of shell core-Au satellite superstructures responded to different concentrations of ochratoxin A. (F) Plot of CD (521 nm) versus the different concentrations of ochratoxin A. Reproduced with permission [70]. Copyright 2018, Wiley-VCH.

Figure 5 The fluorescence-based enantioselective analysis based on semiconductor nanomaterials. (A) Emission spectra of L-cysteine-capped CdSe(ZnS) and D-cysteine-capped CdSe(ZnS) QDs in the presence and absence of D-carnitine or L-carnitine enantiomers. Reproduced with permission [87]. Copyright 2009, American Chemical Society. (B) PL emission spectra of β-CD-Mn-ZnS QDs with the mixed Trp enantiomers at various L-/D-ratios. The inset shows the PL intensity of mixed D- and L-Trp versus the enantiomeric composition of L-Trp. Reproduced with permission [91]. Copyright 2015, Royal Society of Chemistry.
Table 1. Summarized performances of noble metal nanomaterials in enantioselective analysis.
|
|
 下载: 导出CSV

 扫一扫看文章

扫一扫关注我们


 下载:
下载: