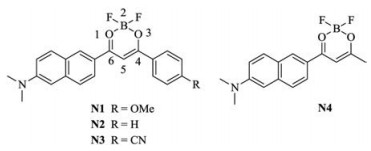
Scheme 1.
Chemical structures of BF2bdks N1-N4.
Difluoroboron β-diketonate dye with intense red/near-infrared fluorescence in solutions and solid states
Nan Liu , Peng-Zhong Chen , Jian-Xin Wang , Li-Ya Niu , Qing-Zheng Yang

Difluoroboron β-diketonate (BF2bdk) complexes have attracted much attention in recent years due to their impressive properties [1-17], such as strong fluorescence in both solution and solid state, large molar absorption coefficients, two-photon excited fluorescence, mechanochromic luminescence and room temperature phosphorescence. Hence, their attractive performances have made them a research focus and these attributes make them have wide applications in various fields, including fluorescence and phosphorescence imaging and sensing [18, 19], organic light-emitting diodes (OLED) [20-22], and photodynamic therapy [23, 24].
The photoluminescence properties of BF2bdks strongly depend on the nature of their substitutions at 4, 6-positions of dioxaborine ring (Scheme 1). In general, BF2bdks with aliphatic groups at both 4, 6-positions are nonfluorescent in visible region due to the limited molecular conjugation, while BF2bdks bearing aryl groups at 4, 6-positions are usually emissive and show tunable emission spectra from visible to near infrared (NIR) region by modulation of structural properties of ligands. In particular, NIR emission (650– 900 nm) has distinct advantages in bioimaging and biosensing [25-27], including low photodamage to biological samples, deep tissue penetration, and minimum interference from background autofluorescence in living biosystems. Accordingly, the development of BF2bdk-based NIR fluorophore is highly desirable and valuable for bioapplications. However, among the most reported BF2bdk complexes, there are only a few reports on the properties and applications of BF2bdk complexes with intense red/near -infrared fluorescence. D'Aléo et al. have developed a series of curcuminoid and hemicurcuminoid based BF2bdk derivatives whose emission red-shifted to red/near-infrared region [28, 29]. However, such structures usually suffer from emission quenching in solid state due to the π–π stacking in aggregation. Herein, we report a BF2bdk derivative N1 that display bright NIR fluorescence in both solution and solid state. By linking naphthalene to the 6- position of dioxaborine ring, BF2bdk complex displays a considerable degree of aromaticity and expands the π-conjugation, leading the absorption/emission wavelength to red shift. Introduction of electron-donating amino groups to the naphthalene ring further shifts their absorption and emission due to the intramolecular charge transfer (ICT) from the ligands to the electron deficient dioxaborine ring. On the other hand, upon modulation of electron-donating or -withdrawing substituents of the aromatic rings on the 4-position, we synthesized compound N1-N4 (Scheme 1) and studied their optical properties in organic solvents and solid states.
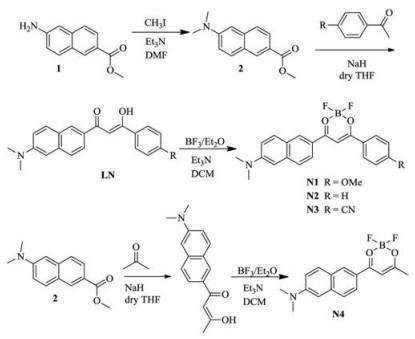
The synthetic routes of BF2bdk complexes N1–N4 are illustrated in Scheme 2. Firstly, the 6-amino-2-naphthoic acid methyl ester reacted with the methyl iodide to obtain N, N'-dimethyl groups. Then, the ketone precursors were deprotonated by NaH before reacting with the desired esters via the Claisen condensation reaction to generate β-diketonate ligands LN. Finally, the BF2bdk complexes N1–N4 were easily prepared from the β-diketonate ligands LN1–LN4 and BF3/Et2O in CH2Cl2. The target compounds N1–N4 were characterized by 1H NMR, 13C NMR spectroscopy and high resolution mass spectrometry (HRMS) analysis (Supporting information).
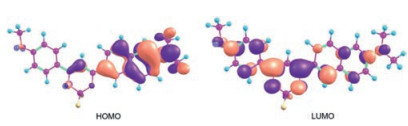
The complexes N1–N4 are typical donor–acceptor (D-A) type fluorophores, with the difluoroboron moiety acting as the electron acceptor and the aminonaphthalene as the electron donor. The UV–vis absorption spectra for dyes N1–N4 in different solvents are shown in Fig. S1 in Supporting information. All the spectra display relatively small absorption bands at λmax < 400 nm, which are assigned to the π–π* transitions. The strong absorption bands ranging from λmax = 455–559 nm have large molar extinction coefficient (ε >5 × 10⁴ L mol-1 cm-1). Such large ε, associated with the bathochromic shift of the lowest-energy transition band with the polarity of the solvent, is characteristic of an ICT. This process was confirmed by the equilibrium geometries of ground (Sn) states of N1-N4 in gas phases which were determined at B3LYP/6–31 G level using DFT method (Fig. 1 and Fig. S2 in Supporting information). In all complexes, the HOMO and LUMO are mainly localized on aminonaphthalene and the dioxaborine ring, respectively, indicating ICT transition from the electron-donating aminonaphthalene units to electron-accepting dioxaborine ring. In addition, the longest absorption maxima are related to the electron-donating/withdrawing ability of the ligands. The absorption maxima of N1-N3 with aryl groups show red-shift compared to N4 in the same type solvent due to the expanded π-conjugation. The most red-shifted spectrum is obtained from the cyano analogues.
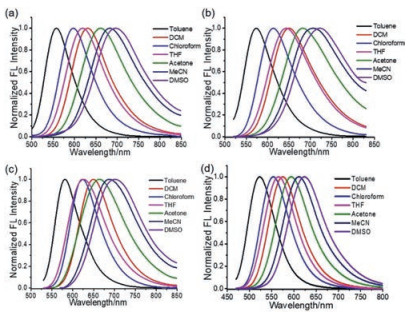
The emission spectra of BF2bdk complexes N1–N4 in different solvents are provided in Fig. 2. All the chromophores display marked positive solvatochromism of their emission. The considerable bathochromic shifts in a polar solvent indicates enlarged dipoles and charge-transfer characteristics in their excited states. For instance, the overall emission bathochromic shifts of N1 is 143 nm from low-polarity toluene to high-polarity dimethyl sulfoxide (DMSO) (Table 1). Besides, the emission quantum efficiency also shows a strong dependence on the solvent's polarity (Table S1 in Supporting information). N1-N4 display strong fluorescence with quantum yields (QY) >90% in nonpolar or less polar solvents. For example, the QYof N1 in toluene is close to unity (~95%). Upon increasing the solvent polarity, a marked decrease in the luminescence efficiency is observed, because ICT state is known to be able to go through nonradiative deactivation in polar solvents. The emission maxima of N1-N3 are red shifted compared to the compound N4 in the CH2Cl2, due to the larger π-conjugation systems. The introduction of different functional groups on the para position of phenyl ring has a significant effect on the emission properties of BF2 complexes. The emission maxima of N1, N2 and N3 is 555, 573 and 582 nm in toluene. N1 possesses ICT process in two directions (D-A-D type), which weakens the whole ICT process and is the possible reason for the blue-shifted emission. Compound N3 with the largest D-A conjugation system displays the most redshifted emission.
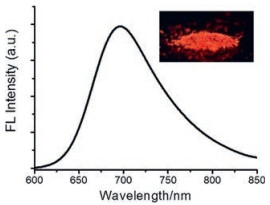
The emission properties of the chromophores N1-N4 in the solid state were also investigated (Fig. 3 and Table S2 in Supporting information). The emission of the four complexes in solid state are located at 690–780 nm in the near-infrared region, significantly red-shifted compared to those in DCM solution, indicating strong intermolecular interactions between chromophores in solid state. Moreover, compound N1 in solid state possesses the highest fluorescence quantum yield of 13% (Φf = 0.13). We assumes that a twist conformation would hamper the tight π–π stacking between the molecules in solid state.
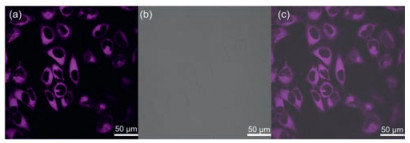
In aqueous media, intrinsic hydrophobicity of aromatic structures of fluorophores will cause the formation of nanoaggregates. The bright fluorescence of N1 in aggregates is a very attractive feature for applications in biological imaging. In addition, compound N1 with large Stokes shift is of great advantage to avoid the interference from excitation and scattered light [30]. We examined the fluorescence imaging performance of N1 in HeLa cells by using confocal laser scanning microscopy (CLSM). As shown in Fig. 4, after incubation with N1 for 30 min, emission NIR channels were observed throughout the cytoplasmic area of the HeLa cells. The result indicates the NIR dye N1 is able to be applied for NIR bioimaging.
In conclusion, we developed a new class of BF2bdk-based dyes containing aminonaphthalene units with intense red/near-infrared fluorescence. They showed red-shifted absorption and emission spectra by introducing electron-withdrawing groups as the other ligand. Particularly, N1 exhibited strong emission with quantum yield of 0.13 in solid state. It was successfully applied for NIR imaging in living cells. Possessing intense molar extinction coefficient, large Stokes shift, positive solvatochromism in different solvents and strong fluorescence in NIR region in aggregations, N1 holds potential application as an environment sensitive probe in living systems.
This work was financially supported by National Natural Science Foundation of China (No. 21525206).
Supplementary material related to this article can be found, in the online version, at doi:https://doi.org/10.1016/j.cclet.2019.04.058.
P.Z. Chen, L.Y. Niu, Y.Z. Chen, Q.Z. Yang, Coord. Chem. Rev. 350(2017) 196-216. doi: 10.1016/j.ccr.2017.06.026
D.H. Kim, A. D'Aléo, X.K. Chen, et al., Nat. Photonics 12(2018) 98-104. doi: 10.1038/s41566-017-0087-y
X.F. Wang, H. Xiao, P.Z. Chen, et al., J. Am. Chem. Soc. 141(2019) 5045-5050. doi: 10.1021/jacs.9b00859
G. Zhang, G.M. Palmer, M.W. Dewhirst, C.L. Fraser, Nat. Mater. 8(2009) 747. doi: 10.1038/nmat2509
W. Huang, X. Zhang, B. Chen, et al., Chem. Commun. (Camb.) 55(2019) 67-70. doi: 10.1039/C8CC08346K
Q. Jiang, M. Zhang, Z. Wang, et al., RSC Adv. 8(2018) 30055-30060. doi: 10.1039/C8RA05031G
L. Wilbraham, M. Louis, D. Alberga, et al., Adv. Mater. 30(2018) 1800817. doi: 10.1002/adma.201800817
P.Z. Chen, H. Zhang, L.Y. Niu, et al., Adv. Funct. Mater. 27(2017) 1700332. doi: 10.1002/adfm.201700332
T. Liu, G. Zhang, R.E. Evans, et al., Chem.-Eur. J. 24(2018) 1859-1869. doi: 10.1002/chem.201703513
P.Z. Chen, L.Y. Niu, H. Zhang, Y.Z. Chen, Q.Z. Yang, Mater. Chem. Front. 2(2018) 1323-1327. doi: 10.1039/C8QM00118A
P.Z. Chen, Y.X. Weng, L.Y. Niu, et al., Angew. Chem. Int. Ed. 55(2016) 2759-2763. doi: 10.1002/anie.201510503
P.Z. Chen, J.X. Wang, L.Y. Niu, Y.Z. Chen, Q.Z. Yang, J. Mater. Chem. C 5(2017) 12538-12546. doi: 10.1039/C7TC04751G
K. Kamada, T. Namikawa, S. Senatore, et al., Chem.-Eur. J. 22(2016) 5219-5232. doi: 10.1002/chem.201504903
M. Louis, R. Sethy, J. Kumar, et al., Chem. Sci. 10(2019) 843-847. doi: 10.1039/C8SC04026E
T. Butler, M. Zhuang, C.L. Fraser, J. Phys.Chem. C 122(2018) 19090-19099. doi: 10.1021/acs.jpcc.8b04762
G.R. Krishna, M.S.R.N. Kiran, C.L. Fraser, U. Ramamurty, C.M. Reddy, Adv. Funct. Mater. 23(2013) 1422-1430. doi: 10.1002/adfm.201201896
G. Zhang, J. Chen, S.J. Payne, et al., J. Am. Chem. Soc. 129(2007) 8942-8943. doi: 10.1021/ja0720255
P. Zhang, Z.Q. Guo, C.X. Yan, W.H. Zhu, Chin. Chem. Lett. 28(2017) 1952-1956. doi: 10.1016/j.cclet.2017.08.038
R.F. Wang, H.Q. Peng, P.Z. Chen, et al., Adv. Funct. Mater. 26(2016) 5419-5425. doi: 10.1002/adfm.201601831
Q. Liao, X.G. Wang, S. Lv, et al., ACS Nano 12(2018) 5359-5367. doi: 10.1021/acsnano.8b00150
C.T. Poon, D. Wu, V.W.W. Yam, Angew. Chem. Int. Ed. 55(2016) 3647-3651. doi: 10.1002/anie.201510946
H.W. Mo, Y. Tsuchiya, Y. Geng, et al., Adv. Funct. Mater. 26(2016) 6703-6710. doi: 10.1002/adfm.201601257
B. Bai, C. Yan, Y. Zhang, Z. Guo, W.H. Zhu, Chem. Commun. (Camb.) 54(2018) 12393-12396. doi: 10.1039/C8CC07376G
K.S. Park, M.K. Kim, Y. Seo, et al., ACS Chem. Neurosci. 8(2017) 2124-2131. doi: 10.1021/acschemneuro.7b00224
W. Chen, Y. Pan, J. Chen, et al., Chin. Chem. Lett. 29(2018) 1429-1435. doi: 10.1016/j.cclet.2018.08.011
P.Z. Chen, H.R. Zheng, L.Y. Niu, et al., Chin. Chem. Lett. 26(2015) 631-635. doi: 10.1016/j.cclet.2015.04.018
Z. Guo, S. Park, J. Yoon, I. Shin, Chem. Soc. Rev. 43(2014) 16-29. doi: 10.1039/C3CS60271K
P.H. Lanoë, B. Mettra, Y.Y. Liao, et al., ChemPhysChem 17(2016) 2128-2136. doi: 10.1002/cphc.201600178
A. Felouat, A. D'Aléo, F. Fages, J. Org. Chem 78(2013) 4446-4455. doi: 10.1021/jo400389h
T.B. Ren, W. Xu, W. Zhang, et al., J. Am. Chem. Soc. 140(2018) 7716-7722. doi: 10.1021/jacs.8b04404

Figure 1 Spatial distributions of the calculated HOMO and LUMO of N1. Calculations are based on ground state geometry by DFT at the B3LYP/6-31G* level.

Figure 2 Normalized fluorescence spectra of (a) N1, (b) N2, (c) N3 and (d) N4 in different solvents (1 ×10⁻⁵ mol/L).

Figure 3 Emission spectrum of N1 in solid state. Inset: photograph of N1 powder under UV lamp at 365 nm.

Figure 4 CLSM images of HeLa cells incubated with N1. (a) NIR channel. (b) Bright field channel. (c) Overlay of (a) and (b).

 扫一扫看文章

扫一扫关注我们
 DownLoad:


 下载:
下载:

 下载:
下载: