Citation:
Deng Liang, Yang Wen-Hui, Lyu Xing, Wei Shu-Feng, Wang Zheng, Wang Hui-Xian. In situ NMR diffusion coefficients assessment of lithium ion conductor using electrochemical priors and Arrhenius constraint-A computational study[J]. Chinese Chemical Letters,
2017, 28(2): 362-366.
doi:
10.1016/j.cclet.2016.10.009
In situ NMR diffusion coefficients assessment of lithium ion conductor using electrochemical priors and Arrhenius constraint-A computational study
Received Date:
30 May 2016 Accepted Date:
02 September 2016 Revised Date:
27 July 2016 Available Online:
01 February 2017
Abstract:In situ NMR measurements of the diffusion coefficients, including an estimate of signal strength, of lithium ion conductor using diffusion-weighting pulse sequence are performed in this study. A cascade bilinear model is proposed to estimate the diffusion sensitivity factors of pulsed-field gradient using prior information of the electrochemical performance and Arrhenius constraint. The model postulates that the active lithium nuclei participating electrochemical reaction are relevant to the NMR signal intensity, when discharge rate or temperature condition is varying. The electrochemical data and the NMR signal strength show a highly fit with the proposed model according our simulation and experiments. Furthermore, the diffusion time is constrained by temperature based on Arrhenius equation of reaction rates dependence. An experimental calculation of Li4Ti5O12 (LTO)/carbon nanotubes (CNTs) with the electrolyte evaluating at 20℃ is presented, which the b factor is estimated by the discharge rate.
Nuclear magnetic resonance (NMR) is a powerful tool for the identification and diffusion detection in electrochemical field [1-9], such as electrolyte structure elucidation and electrolyte ionic conductivity measurement [2]. Recently lithium ion conductor diffusion measurement by the pulsed-field gradient stimulated echo nuclear magnetic resonance (PFGSTE-NMR) has attracted many attentions [2, 10-13]. Moreover, in situ NMR of lithium ion batteries has been investigated in quantitative dendrite detection and chemical shift encoding imaging [14-16].
The pulsed-field gradient diffusion method derives from the landmark paper by Stejskal and Tanner [17]. This technique still forms the basis for most modern diffusion signal formation pulse sequences and consists of two strong gradient pulses of magnitude G and duration d, separated by time interval Δ [18-23]. Richardson et al. measured self diffusion and ionic conductivity for liquid electrolytes by pulsed-field gradient NMR, and the electrolyte is LiBF4 containing propylene carbonate [2]. Hayamizu et al. conducted the research of lithium ion diffusion measurements on solid conductor Li6.6La3Zr1.6Ta0.4O12 by using a pulsed-gradient spinecho NMR method [10]. They also explored the lithium ion diffusion in solid electrolyte (Li2S) 7 (P2S5) 3 based on pulsedgradient spin-echo 7Li NMR spectroscopy [11]. Wu et al. used the pulsed-gradient NMR method to observe the diffusion coefficients and spin-lattice relaxation times in LiTFSI-doped ether- and allyl-functionalized dicationic ionic liquids [12]. Nguyen et al. exploited the PFGSTE-NMR to measure the lithium ion diffusion coefficients of polymer network [13]. However, the parameters G, δ and Δ in the pulsed-gradient NMR method are chosen empirically, and the diffusion-weighting gradients design has the constraints which need to be considered in the specific materials and experimental condition.
Currently the development and the utilization of NMR technical are focused on higher magnetic field strength and dynamic nuclear polarization to boost signal intensities [24]. First at all the ultrahigh magnetic field is hardware expensive. Secondly, the polarization of the electron spin reservoir is transferred to surrounding nuclei by terahertz (microwave) irradiation which may inherently influence the material property. The purpose of the present work is to estimate the diffusion sensitivity factors which aid the pulse-gradient design with electrochemical priors and Arrhenius constraint. The method represents a significant departure from most existing hardware relying methods, and uses electrochemical testing data to optimize the signal-to-noise ratio (SNR) for diffusion-weighted signal.
We build a hypothesis model that the active lithium nuclei participating electrochemical reaction is relevant to the NMR signal strength, when discharge rate or temperature condition is varying. On the other hand, the Arrhenius equation is a formula for the temperature dependence of reaction rates, which is essential for the lithium ion diffusion time Δ setting. The signal attenuation is of dependence on not only the decay of transverse magnetization but also diffusion pattern such as diffraction and collision. In the rest of this paper, we propose a mathematic model to estimate the parameters of gradient pulse sequences design from a signal processing perspective. Then calculations were carried out for Li4Ti5O12 (LTO) /carbon nanotubes (CNTs) composite materials using data of rate performance, temperature performance and Arrhenius constraint.
2.
Results and discussion
2.1
Electrochemical performance and NMR signal
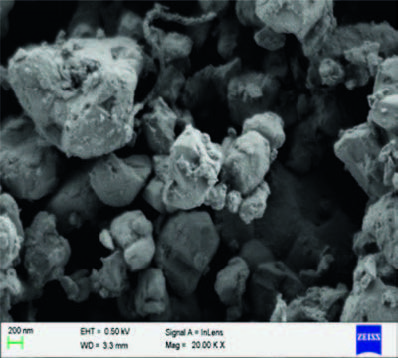
A SEM image of LTO/CNTs powder is showed in Fig. 1. The SEM image can help to elucidate the particle sizes distribution and the CNTs network. The intercalation enhancement by 3-dimensional conductive network of CNTs may in favor of diffusion.
图 1
图 1
SEM image of LTO/CNTs composite material with 1 wt% CNTs.
Figure 1.
SEM image of LTO/CNTs composite material with 1 wt% CNTs.
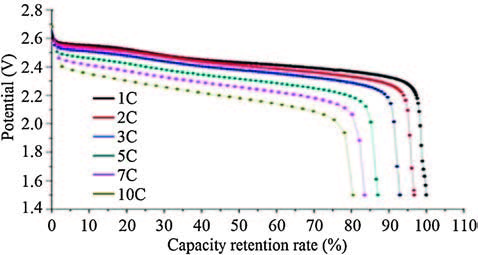
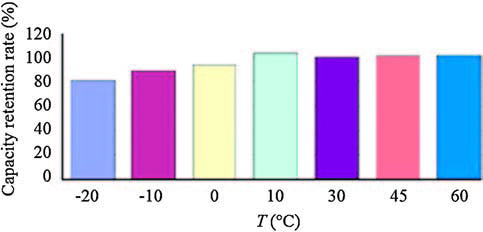
The discharging curves with different discharging rate at room temperature 30 ℃ by 1 C rate charging are showed in Fig. 2. The low-temperature electrochemical performances have been investigated by galvanostatic charge/discharge cyclations in the temperature range -20≤T≤ 60 ℃. Fig. 3 reports the 1 C-capacities of the cell at different temperatures.
图 2
图 2
The potential curves by capacity retention rate of 1C capacity collected at 30 ℃ with different discharge rate.
Figure 2.
The potential curves by capacity retention rate of 1C capacity collected at 30 ℃ with different discharge rate.
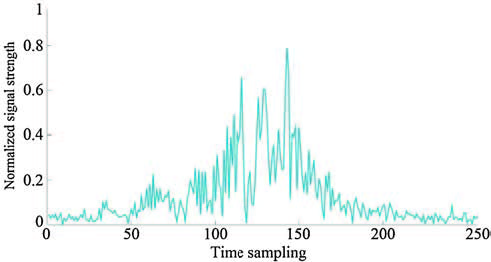
A simulated in situ NMR signal is showed in Fig. 4. We carried out a Monte-Carlo simulation study using a simulation phantom containing 7Li, 1H and 19F. The diffusion process of Li+ is based on Fick's second law and the voltage dynamics, and the NMR echo signals were obtained from isochromats precession simulations [25]. The acquired echo sequences are highly fit with our postulate that the strength of a valid echo signal is approximately in proportion to the dynamic capacity.
2.2
Model estimation using electrochemical performance data
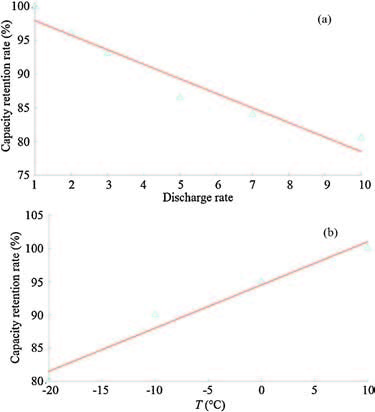
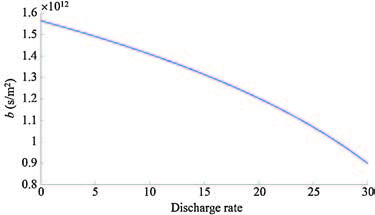
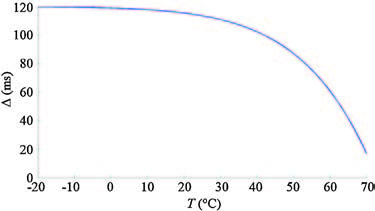
The linear fit of capacity retention rate and discharge rate and temperature is showed in Fig. 5. The fitting uses the least square method. Note that the temperature curve is calculated by the range of -20≤T≤10 ℃, because the capacity retention rate is 100% at T≥10 ℃. Then we substitute the fitting parameters to Eq. (10) to obtain the b value curve with different discharging rate at T = 20 ℃ as shown in Fig. 6, which the diffusion coefficient D is invariant at a fixed temperature. Moreover, the activation energy of LTO in the electrolyte is Ea = 61.8 kJ/mol, and the constrained plot is acquired by Eq. (11), as shown in Fig. 7.
图 5
图 5
Linear fit of capacity retention rate and discharge rate (a) and temperature (b).
Figure 5.
Linear fit of capacity retention rate and discharge rate (a) and temperature (b).
Signal strength is a major concern of in situ NMR diffusion measurement, because the low magnitude of echo signals will lost the proper relationship with the apparent diffusion coefficients (ADC) value. The bandwidth of excitation RF pulses is narrow and centers on the resonance frequency of the 7Li peak. The off resonance nuclei increase when the discharge rate increases Therefore, the magnitude of the transverse magnetization decreases as the off-resonance nuclei increase and the frequency offset increases. In this case, the b value setting should be lower to protect the signal strength. On the other hand, the diffusion time Δ is temperature dependent because of the Arrhenius equation. As the temperature rises, molecules move faster and collide more vigorously, greatly increasing diffusion speed. If the diffusion time was too long, the refocusing echo signal would decay too much and hence the SNR would be insufficient. The diffusion time used here should be constrained by temperature, which is essential for accurate measurement of materials diffusion property.
3.
Conclusion
We proposed a cascade bilinear model to estimate the diffusion sensitivity factors of the pulsed gradient sequence using prior information of the electrochemical performance and Arrhenius constraint. First at all, we assume the capacity retention rate is proportional to the NMR signal retention rate. Then the discharge rate and capacity retention rate are linearly fitted in least-square sense, so are the temperature and the capacity retention rate. Furthermore, the diffusion time (or interval between 2 gradient lobes) is constrained by temperature based on Arrhenius equation of reaction rates dependence. A calculation example of 1 wt% doped LTO/CNTs with the electrolyte evaluating at 20 ℃ is presented, which the b factor is estimated by the discharge rate.
This method differs from existing NMR implement in a fundamental way; instead of trying to achieve ultra-high magnetic field for high-SNR data, our method uses electrochemical information to optimize the signal strength by estimating the parameters of pulsed-field gradient including the ramp width, the plateau width and the amplitude. This approach provides a more effective way to design the NMR pulse sequences with consideration of relaxation rate and diffusion time constraint. In future work, the more sophisticated fitting methodology, such as Bsplines, could be used in electrochemical data modeling, and the more specific gradient pulse sequences can be designed for observing diffusion or diffraction process in lithium ion liquid electrolytes, polymer conductors and solid conductors.
4.
Experimental
4.1
Materials and testing
The LTO/CNTs composite materials have been synthesized using nano-TiO2 powder, Li2CO3 and multi-walled CNTs as raw materials by sand-milling, spray-drying and calcining at 850 ℃ under N2 flow. After being calcined, LTO/CNTs are jet milled as the active material. The LTO/CNTs sample with 1 wt% weight ratio of CNTs addition is prepared. The morphology of the samples is examined by scanning electron microscopy (SEM) (ZEISS SUPRA 55).
The LTO/CNTs powder (90 wt%) mixed with super P conductive carbon (4 wt%) and polyvinylidene fluoride (PVDF) (6 wt%) in Nmethyl pyrrolidone (NMP) solvent to form a homogeneous slurry. The slurry was milled in a ball-milling pot with agate balls for 16 h, and the liquid-to-solid ratio is 65:35. Then the mixture was casted onto aluminum foils and dried in a vacuum drying chamber. A mixture dissolvent of ethylene carbonate (EC), diethyl carbonate (DEC), vinylene carbonate (VC) and LiPF6 was the electrolyte solution.
The test cell was fabricated as LiMn2O4/LTO full-cell, and the more manufacturing details are described in our previous paper [26]. The rate performance and the low temperature performance are investigated by electrochemical workstation (LANHE CT2001A) with voltage range from 1.45 V to 2.75 V.
4.2
In situ NMR
An in situ pulsed-gradient NMR experimental setup used for non-metal bag cell batteries consists of a main magnet and several components. A radio-frequency (RF) coil is capable of generating 90° and 180° pulses for excitation of a spin system, and a magnetic field gradient coil produces the diffusion-weighting gradient. A galvanostatic cycler was used for electrochemical experiments.
4.3
Mathematical model
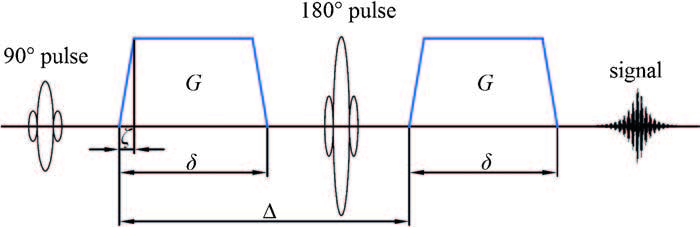
The diffusion-weighting gradient waveforms can be designed as many lobe shape, and the calculation of diffusion sensitivity factor b depends on the choice of gradient waveforms and pulse sequences. A trapezoidal diffusion-weighting gradient lobe in a spin-echo pulse sequence is showed in Fig. 8. The net area of the diffusion weighting gradient waveform before a refocusing RF pulse must be equal to the net area after the refocusing pulse, and the b value can be calculated by the equation
图 8
图 8
The pulsed-field gradient sequence for measurement of lithium ion diffusion.
Figure 8.
The pulsed-field gradient sequence for measurement of lithium ion diffusion.
where Mxy (r, t) is the transverse magnetization component, and D is the diffusion coefficient. The first term on the right side of Eq. (2) is the resonance term and the second term is the diffusion term. Assume that the diffusion takes place after the resonance, and the solution of (2) in the absence of the diffusion term is
$S\left( r,t \right)=E{{e}^{-i\gamma \left( G\cdot r \right)\cdot t}}$
Then the resonance and diffusion take place together, substituting (4) into (2) we have
$E\left( t \right)=E\left( 0 \right){{e}^{-D{{\gamma }^{2}}{{\left( G\cdot t \right)}^{2}}}}$
The diffusion sensitivity factor b can be defined as inner product
$b={{\gamma }^{2}}{{\left( G\cdot t \right)}^{2}}$
Now in order to use electrochemical priors, we postulate that the capacity retention rate is proportional to the signal intensity retention rate
$\frac{E\left( t \right)}{E\left( 0 \right)}\infty \frac{P\left( t \right)}{P\left( 0 \right)}$
Phenomenologically, the discharge rate C and temperature T are linear with the capacity retention rate P
$\frac{P\left( t \right)}{P\left( 0 \right)}={{k}_{1}}C+{{a}_{1}}$
$\frac{P\left( t \right)}{P\left( 0 \right)}={{k}_{2}}T+{{a}_{2}}$
The cascade bilinear model to estimate the diffusion sensitivity factor b of pulsed gradient sequence is
where A is the Arrhenius-equation factor, and R is the Boltzmann constant, and Ea is the activation energy, and k3 is a parameter relevant with T2 relaxation.
Acknowledgments
This work is supported by the National Major Scientific Equipment R & D Project (No. ZDYZ2010-2) and the National Natural Science Foundation of China (No. 51307165).
[1]
X.C. Deng, M. Hu, X.L. Wei. Nuclear magnetic resonance studies of the solvation structures of a high-performance nonaqueous redox flow electrolyte[J]. J. Power Sources.,
2016, 308:
172-179.
doi: 10.1016/j.jpowsour.2015.12.005
[2]
P.M. Richardson, A.M. Voice, I.M. Ward. Pulsed-field gradient NMR self diffusion and ionic conductivity measurements for liquid electrolytes containing LiBF4 and propylene carbonate[J]. Electrochim. Acta.,
2014, 130:
606-618.
doi: 10.1016/j.electacta.2014.03.072
[3]
X.W. Yan, X.H. Ren, S. Stapf, J.D. Wang, Y.R. Yang. Self-diffusion coefficients of organic solvents in linear and branched high density polyethylene particles measured by PFG NMR[J]. Chin. Chem. Lett.,
2008, 19:
110-114.
doi: 10.1016/j.cclet.2007.10.034
[4]
J. Li, Z.F. Geng, P. Liu, Z.W. Deng. NMR analysis of a pair of isomers[J]. Chin. Chem. Lett.,
2012, 23:
1181-1184.
doi: 10.1016/j.cclet.2012.07.008
[5]
C.M. Boyce, N.P. Rice, A.J. Sederman, J.S. Dennis, D .J. Holland, 11-interval PFG pulse sequence for improved measurement of fast velocities of fluids with high diffusivity in systems with short T2*[J]. J. Magn. Reson.,
2016, 265:
67-76.
doi: 10.1016/j.jmr.2016.01.023
[6]
Z.X. Miao, M.X. Jin, X. Liu. The application of HPLC and microprobe NMR spectroscopy in the identification of metabolites in complex biological matrices[J]. Anal. Bioanal. Chem.,
2015, 407:
3405-3416.
doi: 10.1007/s00216-015-8556-y
[7]
J.C. Chen, X.P. Wu, L. Shen. Identification of different tin species in SnO2 nanosheets with 119Sn solid-state NMR spectroscopy[J]. Chem. Phys. Lett.,
2016, 643:
126-130.
doi: 10.1016/j.cplett.2015.11.035
[8]
V. Bon, J. Pallmann, E. Eisbein. Characteristics of flexibility in metalorganic framework solid solutions of composition[Zn2(BME-bdc)x(DBbdc)2-xdabco]n:in situ powder X-ray diffraction, in situ NMR spectroscopy, and molecular dynamics simulations[J]. Microporous Mesoporous Mater.,
2015, 216:
64-74.
doi: 10.1016/j.micromeso.2015.02.042
K. Hayamizu, Y. Matsuda, M. Matsui, N. Imanishi. Lithium ion diffusion measurements on a garnet-type solid conductor Li6.6La3Zr1.6Ta0.4O12 by using a pulsed-gradient spin-echo NMR method[J]. Solid State Nucl. Magn. Reson.,
2015, 70:
21-27.
doi: 10.1016/j.ssnmr.2015.05.002
[11]
K. Hayamizu, Y. Aihara. Lithium ion diffusion in solid electrolyte (Li2S)7(P2S5)3 measured by pulsed-gradient spin-echo 7Li NMR spectroscopy[J]. Solid State Ionics.,
2013, 238:
7-14.
doi: 10.1016/j.ssi.2013.02.014
[12]
T.Y. Wu, S.G. Su, Y.H. Wang. Diffusion coefficients spin-lattice relaxation times, and chemical shift variations of NMR spectra in LiTFSI-doped ether-and allyl-functionalized dicationic ionic liquids[J]. J. Taiwan Inst. Chem. Eng.,
2016, 60:
138-150.
doi: 10.1016/j.jtice.2015.10.047
[13]
G.T.M. Nguyen, A.L. Michan, A. Fannir. Self-standing single lithium ion conductor polymer network with pendant trifluoromethanesulfonylimide groups:Li+ diffusion coefficients from PFGSTE NMR[J]. Eur. Polym. J.,
2013, 49:
4108-4117.
doi: 10.1016/j.eurpolymj.2013.09.016
[14]
N.M. Trease, L.N. Zhou, H.J. Chang, B.Y. Zhu, C.P. Grey. In situ NMR of lithium ion batteries:bulk susceptibility effects and practical considerations[J]. Solid State Nucl. Magn. Reson.,
2012, 42:
62-70.
doi: 10.1016/j.ssnmr.2012.01.004
[15]
R. Bhattacharyya, B. Key, H.L. Chen. In situ NMR observation of the formation of metallic lithium microstructures in lithium batteries[J]. Nat. Mater.,
2010, 9:
504-510.
doi: 10.1038/nmat2764
[16]
S. Chandrashekar, N.M. Trease, H.J. Chang. 7Li MRI of Li batteries reveals location of microstructural lithium[J]. Nat. Mater.,
2012, 11:
311-315.
doi: 10.1038/nmat3246
[17]
E.O. Stejskal, J.E. Tanner. Spin diffusion measurements:spin echoes in the presence of a time-dependent field gradient[J]. J. Chem. Phys.,
1965, 42:
288-292.
doi: 10.1063/1.1695690
[18]
J.H. Burdette, D.D. Durden, A.D. Elster, Y.F. Yen. High b-value diffusionweighted MRI of normal brain[J]. J. Comput. Assist. Tomogr.,
2001, 25:
515-519.
doi: 10.1097/00004728-200107000-00002
[19]
P.Z. Sun. Improved diffusion measurement in heterogeneous systems using the magic asymmetric gradient stimulated echo (MAGSTE) technique[J]. J. Magn. Reson.,
2007, 187:
177-183.
doi: 10.1016/j.jmr.2007.04.011
[20]
J.A. Lehmann-Horn, J.O. Walbrecker. NMR image reconstruction in nonlinearly varying magnetic fields:a numerical algorithm[J]. IEEE Trans. Magn.,
2013, 49:
5430-5437.
doi: 10.1109/TMAG.2013.2266637
[21]
J. Mattiello, P.J. Basser, D. Lebihan. Analytical expressions for the b matrix in NMR diffusion imaging and spectroscopy[J]. J. Magn. Reson. Ser. A.,
1994, 108:
131-141.
doi: 10.1006/jmra.1994.1103
[22]
H. Walderhaug, O. Söderman, D. Topgaard. Self-diffusion in polymer systems studied by magnetic field-gradient spin-echo NMR methods[J]. Prog. Nucl. Magn. Reson. Spectrosc.,
2010, 56:
406-425.
doi: 10.1016/j.pnmrs.2010.04.002
[23]
E. Özarslan, M. Memiç, A.V. Avram, M. Afzali, Rotating field gradient (RFG) MR offers improved orientational sensitivity, Proceedings of the IEEE 12th International Symposium on Biomedical Imaging, IEEE, New York, NY, 2015, pp. 955-958.
[24]
A.B. Barnes, G. De Paëpe, P.C.A. van der Wel. High-field dynamic nuclear polarization for solid and solution biological NMR[J]. Appl. Magn. Reson.,
2008, 34:
237-263.
doi: 10.1007/s00723-008-0129-1
[25]
B.J. Soher, K. Young, A. Bernstein, Z. Aygulac, A.A. Maudsley. GAVA:spectral simulation for in vivo MRS applications,[J]. J. Magn. Reson.,
2007, 185:
291-299.
doi: 10.1016/j.jmr.2007.01.005
[26]
L. Deng, W.H. Yang, S.X. Zhou, J.T. Chen. Effect of carbon nanotubes addition on electrochemical performance and thermal stability of Li4Ti5O12 anode in commercial LiMn2O4/Li4Ti5O12 full-cell[J]. Chin. Chem. Lett.,
2015, 26:
1529-1534.
doi: 10.1016/j.cclet.2015.06.009
Figure 1
SEM image of LTO/CNTs composite material with 1 wt% CNTs.

 下载:
下载:

 下载:
下载:


 下载:
下载: